Bài 7 — Vẽ nhãn, hộp, đường và bảng
- 🇻🇳 Tiếng Việt
- 🇬🇧 English
- 🇰🇷 한국어
- 🇨🇳 中文
Bạn sẽ học: vẽ đối tượng tự do từ onBar — nhãn có chữ, đoạn thẳng, hộp chữ nhật — sửa / xoá chúng theo id, và đặt bảng tóm tắt ở góc biểu đồ.
Đối tượng vẽ và bảng chỉ tạo được trong onBar (Bài 6), qua ctx.draw và ctx.table.
7.1. Nhãn
indicator({
  name: "Nhãn khoảng trống giá",
  pane: "price",
  limits: { labels: 100 },
  onBar: (ctx) => {
    if (ctx.i === 0) return;
    const truoc = ctx.bar(1);
    if (ctx.low > truoc.high) {
      ctx.draw.label({ at: { barsAgo: 0, price: ctx.low }, text: "Gap ↑", style: "up", color: "up", tooltip: `Khoảng trống ${truoc.high} – ${ctx.low}` });
    }
    if (ctx.high < truoc.low) {
      ctx.draw.label({ at: { barsAgo: 0, price: ctx.high }, text: "Gap ↓", style: "down", color: "down" });
    }
  },
  plot: () => ({}),
});
Tuỳ chọn của ctx.draw.label | Nghĩa |
|---|---|
at | Điểm gắn nhãn: { barsAgo: k, price } (k nến trước nến đang tính), { time, price } (mốc thời gian của nến), { barsAhead: k, price } (k nến sau nến cuối — vẽ chiếu về phía trước) |
text | Chữ trên nhãn |
style | Mũi nhọn của nhãn: "up" (nhãn nằm dưới, chỉ lên điểm), "down" (mặc định), "left", "right", "none" |
color, textColor | Màu nền nhãn, màu chữ |
size | "s", "m", "l" |
tooltip | Chữ hiện khi rê chuột |
id | Định danh — xem 7.4 |
plot: () => ({}) — script không có đường nào, chỉ vẽ đối tượng.
7.2. Đoạn thẳng
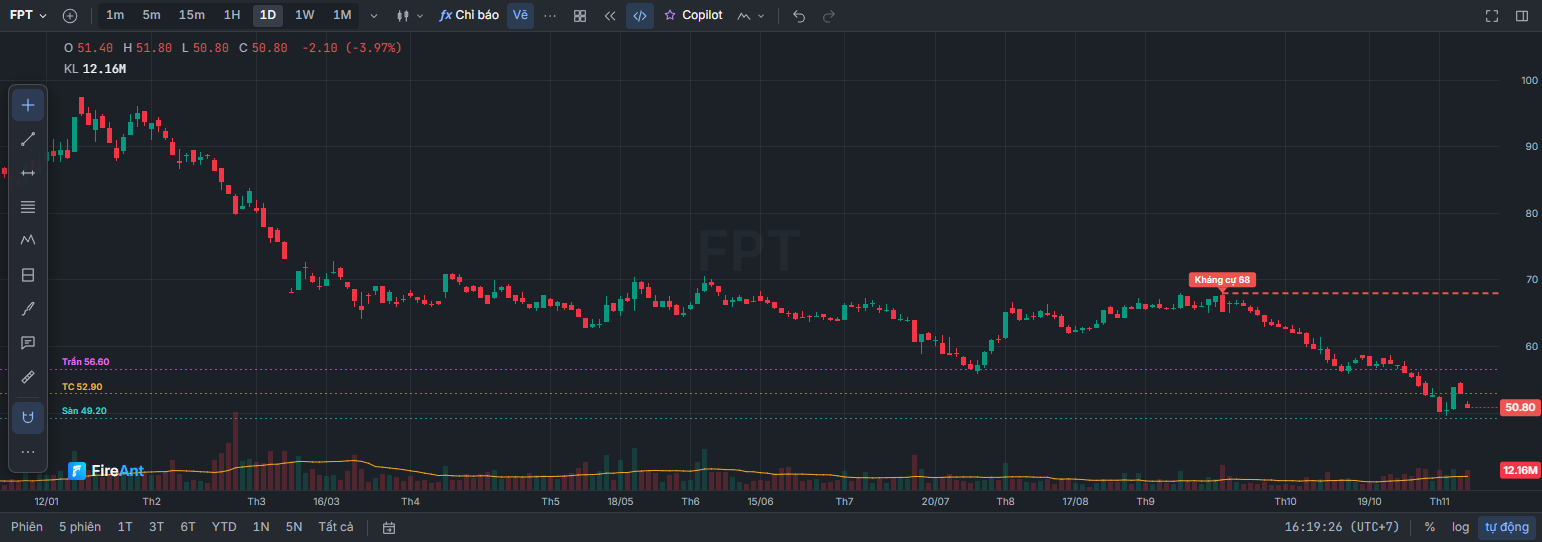
ctx.draw.line({ a, b, … }) nối hai điểm; extend: "right" kéo dài về bên phải. Ví dụ: kẻ mức kháng cự (đỉnh 60 phiên) từ nến lập đỉnh kéo sang phải, luôn cập nhật theo đỉnh mới nhất:
indicator({
  name: "Kháng cự đỉnh 60 phiên",
  pane: "price",
  series: (d) => ({
    dinh: d.high.highest(60),
    tuDinh: d.high.gte(d.high.highest(60)).barsSince(),
  }),
  onBar: (ctx) => {
    if (Number.isNaN(ctx.v.dinh) || Number.isNaN(ctx.v.tuDinh)) return;
    const tu = { barsAgo: ctx.v.tuDinh, price: ctx.v.dinh };
    ctx.draw.line({ id: "khang-cu", a: tu, b: { barsAgo: 0, price: ctx.v.dinh }, extend: "right", color: "down", width: 2, dash: "dash" });
    ctx.draw.label({ id: "nhan-khang-cu", at: tu, text: `Kháng cự ${ctx.v.dinh}`, style: "down", color: "down", size: "s" });
  },
  plot: () => ({}),
});
Tuỳ chọn của line: a, b (điểm như at của nhãn), extend ("none", "left", "right", "both"), color, width, dash ("solid", "dash", "dot").
7.3. Hộp
ctx.draw.box({ a, b, … }) vẽ hình chữ nhật có hai góc đối diện a, b. Ví dụ: hộp bao 20 phiên gần nhất khi biên độ của chúng hẹp (dưới 8 %) — vùng tích luỹ:
indicator({
  name: "Vùng tích luỹ",
  pane: "price",
  params: {
    n: param.int(20, { min: 5, max: 100, label: "Số phiên" }),
    maxRange: param.pct(0.08, { min: 0.02, max: 0.3, label: "Biên độ tối đa" }),
  },
  limits: { boxes: 100 },
  series: (d, p) => ({ cao: d.high.highest(p.n), thap: d.low.lowest(p.n) }),
  state: () => ({ dangCo: false, batDau: 0 }),
  onBar: (ctx, s, p) => {
    const { cao, thap } = ctx.v;
    const hep = cao / thap - 1 <= p.maxRange;
    if (hep && !s.dangCo) {
      s.dangCo = true;
      s.batDau = ctx.bar(p.n - 1).time;
    }
    if (hep) {
      ctx.draw.box({ id: `tl-${s.batDau}`, a: { time: s.batDau, price: cao }, b: { barsAgo: 0, price: thap }, color: "ref", fill: "ref", opacity: 0.1, text: "Tích luỹ" });
    } else s.dangCo = false;
  },
  plot: () => ({}),
});
Tuỳ chọn của box: a, b, color (viền), fill (màu tô), opacity (độ đục phần tô, mặc định 0,12), text.
7.4. Id: sửa thay vì vẽ thêm
- Gọi
ctx.draw.*cóid: nếu đã có đối tượng cùng id thì thay đối tượng đó (di chuyển, đổi chữ). Như ví dụ 7.2: chỉ một đường kháng cự, luôn ở vị trí mới nhất. - Không có
id: mỗi lần gọi là một đối tượng mới — như các nhãn gap ở 7.1. - Id theo thời điểm (
tl-${s.batDau}ở 7.3) giữ mỗi vùng một hộp, và hộp của vùng đang diễn ra được kéo dài theo từng nến. ctx.draw.remove(id)xoá một đối tượng;ctx.draw.clear()xoá tất cả,ctx.draw.clear("label")chỉ xoá nhãn.- Mỗi loại mặc định giữ tối đa 50 đối tượng; vẽ thêm thì cái cũ nhất bị bỏ. Đổi bằng
limits: { lines: 200, boxes: 100, labels: 300 }(tối đa 500 mỗi loại).
7.5. Bảng
ctx.table(tên, { position, header, rows }) đặt một bảng ở một trong 9 vị trí của vùng vẽ. Mỗi vị trí giữ một bảng; gọi lại cùng vị trí thì bảng mới thay bảng cũ — nên gọi ở mọi nến, bảng luôn hiện số của nến cuối.
indicator({
  name: "Bảng tóm tắt kỹ thuật",
  pane: "price",
  series: (d) => ({
    rsi: ta.rsi(d.close, 14),
    ma50: ta.sma(d.close, 50),
    ma200: ta.sma(d.close, 200),
    atr: ta.atr(d, 14),
  }),
  onBar: (ctx) => {
    const { rsi, ma50, ma200, atr } = ctx.v;
    const xuHuong = ma50 > ma200 ? "Tăng" : ma50 < ma200 ? "Giảm" : "—";
    ctx.table("Tóm tắt", {
      position: "top-right",
      header: true,
      rows: [
        ["Chỉ số", "Giá trị"],
        ["RSI 14", { text: rsi, color: rsi > 70 ? "down" : rsi < 30 ? "up" : "text" }],
        ["So với MA 200", { text: ctx.close / ma200 - 1, format: "percent", color: ctx.close > ma200 ? "up" : "down" }],
        ["ATR / giá", { text: atr / ctx.close, format: "percent" }],
        ["Xu hướng MA 50/200", { text: xuHuong, color: xuHuong === "Tăng" ? "up" : xuHuong === "Giảm" ? "down" : "textMuted" }],
      ],
    });
  },
  plot: () => ({}),
});
position | "top-left", "top-center", "top-right" (mặc định), "middle-left", "middle-center", "middle-right", "bottom-left", "bottom-center", "bottom-right" |
header: true | Dòng đầu là tiêu đề (chữ đậm hơn) |
rows | Mảng các dòng; mỗi dòng là mảng ô. Ô là chữ, số, hoặc { text, format, color, bg, tooltip } |
format của ô | "percent" (0,123 → 12,3 %), "integer", "volume" / "compact" (1,2 Tr), "price", "number" |
Mỗi bảng tối đa 100 ô. ctx.table(tên, null) xoá bảng.
7.6. Đỉnh, đáy xác nhận và nhãn
Đỉnh cục bộ chỉ xác nhận được sau khi đủ nến phía sau thấp hơn nó. Ví dụ đánh dấu đỉnh / đáy trong cửa sổ 2n + 1 nến, nhãn đặt lùi về đúng nến đỉnh (không nhìn trước: nhãn xuất hiện ở nến thứ n sau đỉnh):
indicator({
  name: "Đỉnh / đáy xác nhận",
  pane: "price",
  params: { n: param.int(5, { min: 2, max: 30, label: "Số nến mỗi bên" }) },
  limits: { labels: 300 },
  onBar: (ctx, s, p) => {
    if (ctx.i < 2 * p.n) return;
    const giua = ctx.bar(p.n);
    let dinh = true;
    let day = true;
    for (let k = 0; k <= 2 * p.n; k++) {
      if (k === p.n) continue;
      const b = ctx.bar(k);
      if (b.high >= giua.high) dinh = false;
      if (b.low <= giua.low) day = false;
    }
    if (dinh) ctx.draw.label({ at: { barsAgo: p.n, price: giua.high }, text: "Đ", style: "down", color: "down", size: "s" });
    if (day) ctx.draw.label({ at: { barsAgo: p.n, price: giua.low }, text: "Đáy", style: "up", color: "up", size: "s" });
  },
  plot: () => ({}),
});
Bài tập
Vẽ đoạn thẳng nối hai đáy xác nhận gần nhất (đường xu hướng đáy), kéo dài sang phải.
Lời giải
indicator({
  name: "Đường nối hai đáy gần nhất",
  pane: "price",
  params: { n: param.int(5, { min: 2, max: 30, label: "Số nến mỗi bên" }) },
  state: () => ({ days: [] }),
  onBar: (ctx, s, p) => {
    if (ctx.i < 2 * p.n) return;
    const giua = ctx.bar(p.n);
    let day = true;
    for (let k = 0; k <= 2 * p.n; k++) if (k !== p.n && ctx.bar(k).low <= giua.low) day = false;
    if (day) {
      s.days.push({ time: giua.time, price: giua.low });
      if (s.days.length > 2) s.days.shift();
    }
    if (s.days.length === 2) {
      ctx.draw.line({ id: "xu-huong-day", a: s.days[0], b: s.days[1], extend: "right", color: "up", width: 2 });
    }
  },
  plot: () => ({}),
});
Điểm { time, price } gắn đúng nến theo mốc thời gian, nên lưu được trong trạng thái và dùng lại ở nến sau.
Tiếp theo: Bài 8 — Khung lớn hơn và dữ liệu khác
You will learn: how to draw free-form objects from onBar — text labels, line segments, rectangles — edit / delete them by id, and place a summary table in a corner of the chart.
Drawing objects and tables can only be created in onBar (Lesson 6), through ctx.draw and ctx.table.
7.1. Labels
indicator({
  name: "Nhãn khoảng trống giá",
  pane: "price",
  limits: { labels: 100 },
  onBar: (ctx) => {
    if (ctx.i === 0) return;
    const truoc = ctx.bar(1);
    if (ctx.low > truoc.high) {
      ctx.draw.label({ at: { barsAgo: 0, price: ctx.low }, text: "Gap ↑", style: "up", color: "up", tooltip: `Khoảng trống ${truoc.high} – ${ctx.low}` });
    }
    if (ctx.high < truoc.low) {
      ctx.draw.label({ at: { barsAgo: 0, price: ctx.high }, text: "Gap ↓", style: "down", color: "down" });
    }
  },
  plot: () => ({}),
});
ctx.draw.label option | Meaning |
|---|---|
at | Anchor point: { barsAgo: k, price } (k candles before the current candle), { time, price } (the candle's timestamp), { barsAhead: k, price } (k candles after the last candle — projecting forward) |
text | The label text |
style | The label's pointer: "up" (label sits below, pointing up at the point), "down" (default), "left", "right", "none" |
color, textColor | Label background color, text color |
size | "s", "m", "l" |
tooltip | Text shown on hover |
id | Identifier — see 7.4 |
plot: () => ({}) — the script has no lines; it only draws objects.
7.2. Line segments
ctx.draw.line({ a, b, … }) connects two points; extend: "right" extends it to the right. Example: draw the resistance level (the 60-session high) from the candle that set the high, extended to the right and always updated to the latest high:
indicator({
  name: "Kháng cự đỉnh 60 phiên",
  pane: "price",
  series: (d) => ({
    dinh: d.high.highest(60),
    tuDinh: d.high.gte(d.high.highest(60)).barsSince(),
  }),
  onBar: (ctx) => {
    if (Number.isNaN(ctx.v.dinh) || Number.isNaN(ctx.v.tuDinh)) return;
    const tu = { barsAgo: ctx.v.tuDinh, price: ctx.v.dinh };
    ctx.draw.line({ id: "khang-cu", a: tu, b: { barsAgo: 0, price: ctx.v.dinh }, extend: "right", color: "down", width: 2, dash: "dash" });
    ctx.draw.label({ id: "nhan-khang-cu", at: tu, text: `Kháng cự ${ctx.v.dinh}`, style: "down", color: "down", size: "s" });
  },
  plot: () => ({}),
});
line options: a, b (points, like a label's at), extend ("none", "left", "right", "both"), color, width, dash ("solid", "dash", "dot").
7.3. Boxes
ctx.draw.box({ a, b, … }) draws a rectangle with opposite corners a and b. Example: a box around the latest 20 sessions when their range is narrow (under 8%) — a consolidation zone:
indicator({
  name: "Vùng tích luỹ",
  pane: "price",
  params: {
    n: param.int(20, { min: 5, max: 100, label: "Số phiên" }),
    maxRange: param.pct(0.08, { min: 0.02, max: 0.3, label: "Biên độ tối đa" }),
  },
  limits: { boxes: 100 },
  series: (d, p) => ({ cao: d.high.highest(p.n), thap: d.low.lowest(p.n) }),
  state: () => ({ dangCo: false, batDau: 0 }),
  onBar: (ctx, s, p) => {
    const { cao, thap } = ctx.v;
    const hep = cao / thap - 1 <= p.maxRange;
    if (hep && !s.dangCo) {
      s.dangCo = true;
      s.batDau = ctx.bar(p.n - 1).time;
    }
    if (hep) {
      ctx.draw.box({ id: `tl-${s.batDau}`, a: { time: s.batDau, price: cao }, b: { barsAgo: 0, price: thap }, color: "ref", fill: "ref", opacity: 0.1, text: "Tích luỹ" });
    } else s.dangCo = false;
  },
  plot: () => ({}),
});
box options: a, b, color (border), fill (fill color), opacity (fill opacity, default 0.12), text.
7.4. Ids: update instead of drawing more
- Calling
ctx.draw.*with anid: if an object with the same id already exists, it is replaced (moved, text changed). As in example 7.2: only one resistance line, always at the latest position. - Without an
id: every call creates a new object — like the gap labels in 7.1. - A time-based id (
tl-${s.batDau}in 7.3) keeps one box per zone, and the box of the ongoing zone is extended candle by candle. ctx.draw.remove(id)deletes one object;ctx.draw.clear()deletes all of them,ctx.draw.clear("label")deletes only labels.- By default each type keeps at most 50 objects; drawing more drops the oldest. Change this with
limits: { lines: 200, boxes: 100, labels: 300 }(up to 500 per type).
7.5. Tables
ctx.table(tên, { position, header, rows }) (name) places a table in one of 9 positions of the plot area. Each position holds one table; calling again at the same position replaces the old table with the new one — so call it on every candle and the table always shows the numbers of the last candle.
indicator({
  name: "Bảng tóm tắt kỹ thuật",
  pane: "price",
  series: (d) => ({
    rsi: ta.rsi(d.close, 14),
    ma50: ta.sma(d.close, 50),
    ma200: ta.sma(d.close, 200),
    atr: ta.atr(d, 14),
  }),
  onBar: (ctx) => {
    const { rsi, ma50, ma200, atr } = ctx.v;
    const xuHuong = ma50 > ma200 ? "Tăng" : ma50 < ma200 ? "Giảm" : "—";
    ctx.table("Tóm tắt", {
      position: "top-right",
      header: true,
      rows: [
        ["Chỉ số", "Giá trị"],
        ["RSI 14", { text: rsi, color: rsi > 70 ? "down" : rsi < 30 ? "up" : "text" }],
        ["So với MA 200", { text: ctx.close / ma200 - 1, format: "percent", color: ctx.close > ma200 ? "up" : "down" }],
        ["ATR / giá", { text: atr / ctx.close, format: "percent" }],
        ["Xu hướng MA 50/200", { text: xuHuong, color: xuHuong === "Tăng" ? "up" : xuHuong === "Giảm" ? "down" : "textMuted" }],
      ],
    });
  },
  plot: () => ({}),
});
position | "top-left", "top-center", "top-right" (default), "middle-left", "middle-center", "middle-right", "bottom-left", "bottom-center", "bottom-right" |
header: true | The first row is a header (bolder text) |
rows | An array of rows; each row is an array of cells. A cell is text, a number, or { text, format, color, bg, tooltip } |
Cell format | "percent" (0.123 → 12.3%), "integer", "volume" / "compact" (1,2 Tr — i.e. 1.2 mn), "price", "number" |
Each table holds up to 100 cells. ctx.table(tên, null) (name) deletes the table.
7.6. Confirmed highs, lows and labels
A local high can only be confirmed once enough later candles are lower than it. Example: marking highs / lows within a window of 2n + 1 candles, with the label placed back on the exact high candle (no look-ahead: the label appears on the n-th candle after the high):
indicator({
  name: "Đỉnh / đáy xác nhận",
  pane: "price",
  params: { n: param.int(5, { min: 2, max: 30, label: "Số nến mỗi bên" }) },
  limits: { labels: 300 },
  onBar: (ctx, s, p) => {
    if (ctx.i < 2 * p.n) return;
    const giua = ctx.bar(p.n);
    let dinh = true;
    let day = true;
    for (let k = 0; k <= 2 * p.n; k++) {
      if (k === p.n) continue;
      const b = ctx.bar(k);
      if (b.high >= giua.high) dinh = false;
      if (b.low <= giua.low) day = false;
    }
    if (dinh) ctx.draw.label({ at: { barsAgo: p.n, price: giua.high }, text: "Đ", style: "down", color: "down", size: "s" });
    if (day) ctx.draw.label({ at: { barsAgo: p.n, price: giua.low }, text: "Đáy", style: "up", color: "up", size: "s" });
  },
  plot: () => ({}),
});
Exercise
Draw a line segment connecting the two most recent confirmed lows (a trendline of lows), extended to the right.
Solution
indicator({
  name: "Đường nối hai đáy gần nhất",
  pane: "price",
  params: { n: param.int(5, { min: 2, max: 30, label: "Số nến mỗi bên" }) },
  state: () => ({ days: [] }),
  onBar: (ctx, s, p) => {
    if (ctx.i < 2 * p.n) return;
    const giua = ctx.bar(p.n);
    let day = true;
    for (let k = 0; k <= 2 * p.n; k++) if (k !== p.n && ctx.bar(k).low <= giua.low) day = false;
    if (day) {
      s.days.push({ time: giua.time, price: giua.low });
      if (s.days.length > 2) s.days.shift();
    }
    if (s.days.length === 2) {
      ctx.draw.line({ id: "xu-huong-day", a: s.days[0], b: s.days[1], extend: "right", color: "up", width: 2 });
    }
  },
  plot: () => ({}),
});
A { time, price } point anchors to the exact candle by timestamp, so it can be stored in state and reused on later candles.
배울 내용: onBar에서 자유로운 객체 그리기 — 글자가 있는 라벨, 선분, 직사각형 박스 — id로 수정 / 삭제하기, 그리고 차트 모서리에 요약 표 두기.
그리기 객체와 표는 onBar(6강) 안에서 ctx.draw와 ctx.table로만 만들 수 있습니다.
7.1. 라벨
indicator({
  name: "Nhãn khoảng trống giá",
  pane: "price",
  limits: { labels: 100 },
  onBar: (ctx) => {
    if (ctx.i === 0) return;
    const truoc = ctx.bar(1);
    if (ctx.low > truoc.high) {
      ctx.draw.label({ at: { barsAgo: 0, price: ctx.low }, text: "Gap ↑", style: "up", color: "up", tooltip: `Khoảng trống ${truoc.high} – ${ctx.low}` });
    }
    if (ctx.high < truoc.low) {
      ctx.draw.label({ at: { barsAgo: 0, price: ctx.high }, text: "Gap ↓", style: "down", color: "down" });
    }
  },
  plot: () => ({}),
});
ctx.draw.label 옵션 | 의미 |
|---|---|
at | 라벨을 붙일 지점: { barsAgo: k, price }(계산 중인 캔들보다 k캔들 전), { time, price }(캔들의 타임스탬프), { barsAhead: k, price }(마지막 캔들보다 k캔들 뒤 — 앞쪽으로 투영해 그리기) |
text | 라벨의 글자 |
style | 라벨의 뾰족한 끝: "up"(라벨이 아래에 있고 지점을 위로 가리킴), "down"(기본값), "left", "right", "none" |
color, textColor | 라벨 배경색, 글자색 |
size | "s", "m", "l" |
tooltip | 마우스를 올리면 나타나는 글자 |
id | 식별자 — 7.4 참고 |
plot: () => ({}) — 스크립트에 선이 없고 객체만 그립니다.
7.2. 선분
ctx.draw.line({ a, b, … })은 두 점을 잇고, extend: "right"는 오른쪽으로 연장합니다. 예: 고점을 만든 캔들부터 오른쪽으로 저항선(60세션 고점)을 긋고, 항상 최신 고점에 맞춰 갱신합니다.
indicator({
  name: "Kháng cự đỉnh 60 phiên",
  pane: "price",
  series: (d) => ({
    dinh: d.high.highest(60),
    tuDinh: d.high.gte(d.high.highest(60)).barsSince(),
  }),
  onBar: (ctx) => {
    if (Number.isNaN(ctx.v.dinh) || Number.isNaN(ctx.v.tuDinh)) return;
    const tu = { barsAgo: ctx.v.tuDinh, price: ctx.v.dinh };
    ctx.draw.line({ id: "khang-cu", a: tu, b: { barsAgo: 0, price: ctx.v.dinh }, extend: "right", color: "down", width: 2, dash: "dash" });
    ctx.draw.label({ id: "nhan-khang-cu", at: tu, text: `Kháng cự ${ctx.v.dinh}`, style: "down", color: "down", size: "s" });
  },
  plot: () => ({}),
});
line의 옵션: a, b(라벨의 at과 같은 점), extend("none", "left", "right", "both"), color, width, dash("solid", "dash", "dot").
7.3. 박스
ctx.draw.box({ a, b, … })는 마주 보는 두 모서리 a, b로 직사각형을 그립니다. 예: 최근 20세션의 변동폭이 좁을 때(8 % 미만) 그 구간을 감싸는 박스 — 횡보 구간:
indicator({
  name: "Vùng tích luỹ",
  pane: "price",
  params: {
    n: param.int(20, { min: 5, max: 100, label: "Số phiên" }),
    maxRange: param.pct(0.08, { min: 0.02, max: 0.3, label: "Biên độ tối đa" }),
  },
  limits: { boxes: 100 },
  series: (d, p) => ({ cao: d.high.highest(p.n), thap: d.low.lowest(p.n) }),
  state: () => ({ dangCo: false, batDau: 0 }),
  onBar: (ctx, s, p) => {
    const { cao, thap } = ctx.v;
    const hep = cao / thap - 1 <= p.maxRange;
    if (hep && !s.dangCo) {
      s.dangCo = true;
      s.batDau = ctx.bar(p.n - 1).time;
    }
    if (hep) {
      ctx.draw.box({ id: `tl-${s.batDau}`, a: { time: s.batDau, price: cao }, b: { barsAgo: 0, price: thap }, color: "ref", fill: "ref", opacity: 0.1, text: "Tích luỹ" });
    } else s.dangCo = false;
  },
  plot: () => ({}),
});
box의 옵션: a, b, color(테두리), fill(채움색), opacity(채움 불투명도, 기본값 0.12), text.
7.4. Id: 새로 그리지 말고 수정하기
id가 있는ctx.draw.*호출: 같은 id의 객체가 이미 있으면 그 객체를 대체합니다(이동, 글자 변경). 예제 7.2처럼 저항선이 하나뿐이며 항상 최신 위치에 있습니다.id가 없으면: 호출할 때마다 새 객체가 생깁니다. 7.1의 갭 라벨처럼요.- 시점 기반 id(7.3의
tl-${s.batDau})는 구간마다 박스 하나를 유지하고, 진행 중인 구간의 박스는 캔들마다 늘어납니다. ctx.draw.remove(id)는 객체 하나를 지우고,ctx.draw.clear()는 모두 지우며,ctx.draw.clear("label")은 라벨만 지웁니다.- 종류별로 기본 최대 50개 객체를 보관하며, 더 그리면 가장 오래된 것이 버려집니다.
limits: { lines: 200, boxes: 100, labels: 300 }으로 바꿉니다(종류별 최대 500).
7.5. 표
ctx.table(이름, { position, header, rows })는 그리기 영역의 9개 위치 중 하나에 표를 둡니다. 위치마다 표 하나를 유지하며, 같은 위치로 다시 호출하면 새 표가 기존 표를 대체합니다. 그래서 모든 캔들에서 호출하면 표는 항상 마지막 캔들의 숫자를 보여 줍니다.
indicator({
  name: "Bảng tóm tắt kỹ thuật",
  pane: "price",
  series: (d) => ({
    rsi: ta.rsi(d.close, 14),
    ma50: ta.sma(d.close, 50),
    ma200: ta.sma(d.close, 200),
    atr: ta.atr(d, 14),
  }),
  onBar: (ctx) => {
    const { rsi, ma50, ma200, atr } = ctx.v;
    const xuHuong = ma50 > ma200 ? "Tăng" : ma50 < ma200 ? "Giảm" : "—";
    ctx.table("Tóm tắt", {
      position: "top-right",
      header: true,
      rows: [
        ["Chỉ số", "Giá trị"],
        ["RSI 14", { text: rsi, color: rsi > 70 ? "down" : rsi < 30 ? "up" : "text" }],
        ["So với MA 200", { text: ctx.close / ma200 - 1, format: "percent", color: ctx.close > ma200 ? "up" : "down" }],
        ["ATR / giá", { text: atr / ctx.close, format: "percent" }],
        ["Xu hướng MA 50/200", { text: xuHuong, color: xuHuong === "Tăng" ? "up" : xuHuong === "Giảm" ? "down" : "textMuted" }],
      ],
    });
  },
  plot: () => ({}),
});
position | "top-left", "top-center", "top-right"(기본값), "middle-left", "middle-center", "middle-right", "bottom-left", "bottom-center", "bottom-right" |
header: true | 첫 줄은 제목(더 굵은 글자) |
rows | 줄의 배열이며, 각 줄은 셀의 배열입니다. 셀은 문자, 숫자, 또는 { text, format, color, bg, tooltip } |
셀의 format | "percent"(0.123 → 12.3 %), "integer", "volume" / "compact"(1,2 Tr), "price", "number" |
표 하나에 셀은 최대 100개입니다. ctx.table(이름, null)은 표를 지웁니다.
7.6. 확인된 고점, 저점과 라벨
국소 고점은 그 뒤에 더 낮은 캔들이 충분히 나온 다음에야 확인됩니다. 2n + 1캔들 창에서 고점 / 저점을 표시하고, 라벨을 고점 캔들 위치로 되돌려 붙이는 예입니다(미래 참조 없음: 라벨은 고점 이후 n번째 캔들에서 나타남).
indicator({
  name: "Đỉnh / đáy xác nhận",
  pane: "price",
  params: { n: param.int(5, { min: 2, max: 30, label: "Số nến mỗi bên" }) },
  limits: { labels: 300 },
  onBar: (ctx, s, p) => {
    if (ctx.i < 2 * p.n) return;
    const giua = ctx.bar(p.n);
    let dinh = true;
    let day = true;
    for (let k = 0; k <= 2 * p.n; k++) {
      if (k === p.n) continue;
      const b = ctx.bar(k);
      if (b.high >= giua.high) dinh = false;
      if (b.low <= giua.low) day = false;
    }
    if (dinh) ctx.draw.label({ at: { barsAgo: p.n, price: giua.high }, text: "Đ", style: "down", color: "down", size: "s" });
    if (day) ctx.draw.label({ at: { barsAgo: p.n, price: giua.low }, text: "Đáy", style: "up", color: "up", size: "s" });
  },
  plot: () => ({}),
});
연습 문제
가장 최근의 확인된 두 저점을 잇는 선분(저점 추세선)을 그리고 오른쪽으로 연장하세요.
풀이
indicator({
  name: "Đường nối hai đáy gần nhất",
  pane: "price",
  params: { n: param.int(5, { min: 2, max: 30, label: "Số nến mỗi bên" }) },
  state: () => ({ days: [] }),
  onBar: (ctx, s, p) => {
    if (ctx.i < 2 * p.n) return;
    const giua = ctx.bar(p.n);
    let day = true;
    for (let k = 0; k <= 2 * p.n; k++) if (k !== p.n && ctx.bar(k).low <= giua.low) day = false;
    if (day) {
      s.days.push({ time: giua.time, price: giua.low });
      if (s.days.length > 2) s.days.shift();
    }
    if (s.days.length === 2) {
      ctx.draw.line({ id: "xu-huong-day", a: s.days[0], b: s.days[1], extend: "right", color: "up", width: 2 });
    }
  },
  plot: () => ({}),
});
{ time, price } 점은 타임스탬프로 정확한 캔들에 붙으므로, 상태에 저장했다가 이후 캔들에서 다시 쓸 수 있습니다.
您将学到: 从 onBar 自由绘制对象——带文字的标签、线段、矩形框——按 id 修改 / 删除它们,以及在图表角落放置汇总表格。
绘图对象和表格只能在 onBar(第 6 课)中通过 ctx.draw 和 ctx.table 创建。
7.1. 标签
indicator({
  name: "Nhãn khoảng trống giá",
  pane: "price",
  limits: { labels: 100 },
  onBar: (ctx) => {
    if (ctx.i === 0) return;
    const truoc = ctx.bar(1);
    if (ctx.low > truoc.high) {
      ctx.draw.label({ at: { barsAgo: 0, price: ctx.low }, text: "Gap ↑", style: "up", color: "up", tooltip: `Khoảng trống ${truoc.high} – ${ctx.low}` });
    }
    if (ctx.high < truoc.low) {
      ctx.draw.label({ at: { barsAgo: 0, price: ctx.high }, text: "Gap ↓", style: "down", color: "down" });
    }
  },
  plot: () => ({}),
});
ctx.draw.label 的选项 | 含义 |
|---|---|
at | 标签锚点:{ barsAgo: k, price }(当前计算 K 线之前第 k 根),{ time, price }(K 线的时间戳),{ barsAhead: k, price }(最后一根 K 线之后第 k 根——向前投射绘制) |
text | 标签上的文字 |
style | 标签尖角:"up"(标签在下方,指向上方的点),"down"(默认),"left","right","none" |
color, textColor | 标签背景色、文字颜色 |
size | "s", "m", "l" |
tooltip | 鼠标悬停时显示的文字 |
id | 标识——见 7.4 |
plot: () => ({})——脚本没有任何线,只绘制对象。
7.2. 线段
ctx.draw.line({ a, b, … }) 连接两个点;extend: "right" 向右延伸。示例:从创出高点的 K 线向右画出阻力位(60 个交易时段高点),并始终随最新高点更新:
indicator({
  name: "Kháng cự đỉnh 60 phiên",
  pane: "price",
  series: (d) => ({
    dinh: d.high.highest(60),
    tuDinh: d.high.gte(d.high.highest(60)).barsSince(),
  }),
  onBar: (ctx) => {
    if (Number.isNaN(ctx.v.dinh) || Number.isNaN(ctx.v.tuDinh)) return;
    const tu = { barsAgo: ctx.v.tuDinh, price: ctx.v.dinh };
    ctx.draw.line({ id: "khang-cu", a: tu, b: { barsAgo: 0, price: ctx.v.dinh }, extend: "right", color: "down", width: 2, dash: "dash" });
    ctx.draw.label({ id: "nhan-khang-cu", at: tu, text: `Kháng cự ${ctx.v.dinh}`, style: "down", color: "down", size: "s" });
  },
  plot: () => ({}),
});
line 的选项:a、b(与标签的 at 相同的点),extend("none"、"left"、"right"、"both"),color,width,dash("solid"、"dash"、"dot")。
7.3. 矩形框
ctx.draw.box({ a, b, … }) 以 a、b 两个对角绘制矩形。示例:当最近 20 个交易时段振幅较窄(低于 8%)时,用框圈出——即盘整区:
indicator({
  name: "Vùng tích luỹ",
  pane: "price",
  params: {
    n: param.int(20, { min: 5, max: 100, label: "Số phiên" }),
    maxRange: param.pct(0.08, { min: 0.02, max: 0.3, label: "Biên độ tối đa" }),
  },
  limits: { boxes: 100 },
  series: (d, p) => ({ cao: d.high.highest(p.n), thap: d.low.lowest(p.n) }),
  state: () => ({ dangCo: false, batDau: 0 }),
  onBar: (ctx, s, p) => {
    const { cao, thap } = ctx.v;
    const hep = cao / thap - 1 <= p.maxRange;
    if (hep && !s.dangCo) {
      s.dangCo = true;
      s.batDau = ctx.bar(p.n - 1).time;
    }
    if (hep) {
      ctx.draw.box({ id: `tl-${s.batDau}`, a: { time: s.batDau, price: cao }, b: { barsAgo: 0, price: thap }, color: "ref", fill: "ref", opacity: 0.1, text: "Tích luỹ" });
    } else s.dangCo = false;
  },
  plot: () => ({}),
});
box 的选项:a、b、color(边框)、fill(填充色)、opacity(填充部分的不透明度,默认 0.12)、text。
7.4. Id:修改而不是追加绘制
- 带
id调用ctx.draw.*:如果已有相同 id 的对象,则替换该对象(移动、改文字)。如 7.2 的示例:只有一条阻力线,始终位于最新位置。 - 不带
id:每次调用都是一个新对象——如 7.1 中的缺口标签。 - 按时间点生成的 id(7.3 中的
tl-${s.batDau})让每个区域只有一个框,正在进行的区域的框会随每根 K 线延长。 ctx.draw.remove(id)删除一个对象;ctx.draw.clear()删除全部,ctx.draw.clear("label")只删除标签。- 每种类型默认最多保留 50 个对象;继续绘制时最旧的会被丢弃。可用
limits: { lines: 200, boxes: 100, labels: 300 }修改(每种最多 500)。
7.5. 表格
ctx.table(tên, { position, header, rows }) 把表格放在绘图区 9 个位置之一。每个位置只保留一张表;在同一位置再次调用时,新表替换旧表——因此在每根 K 线上调用,表格就始终显示最后一根 K 线的数字。
indicator({
  name: "Bảng tóm tắt kỹ thuật",
  pane: "price",
  series: (d) => ({
    rsi: ta.rsi(d.close, 14),
    ma50: ta.sma(d.close, 50),
    ma200: ta.sma(d.close, 200),
    atr: ta.atr(d, 14),
  }),
  onBar: (ctx) => {
    const { rsi, ma50, ma200, atr } = ctx.v;
    const xuHuong = ma50 > ma200 ? "Tăng" : ma50 < ma200 ? "Giảm" : "—";
    ctx.table("Tóm tắt", {
      position: "top-right",
      header: true,
      rows: [
        ["Chỉ số", "Giá trị"],
        ["RSI 14", { text: rsi, color: rsi > 70 ? "down" : rsi < 30 ? "up" : "text" }],
        ["So với MA 200", { text: ctx.close / ma200 - 1, format: "percent", color: ctx.close > ma200 ? "up" : "down" }],
        ["ATR / giá", { text: atr / ctx.close, format: "percent" }],
        ["Xu hướng MA 50/200", { text: xuHuong, color: xuHuong === "Tăng" ? "up" : xuHuong === "Giảm" ? "down" : "textMuted" }],
      ],
    });
  },
  plot: () => ({}),
});
position | "top-left", "top-center", "top-right"(默认), "middle-left", "middle-center", "middle-right", "bottom-left", "bottom-center", "bottom-right" |
header: true | 第一行为标题(字体更粗) |
rows | 行的数组;每行是单元格数组。单元格可以是文字、数字或 { text, format, color, bg, tooltip } |
单元格的 format | "percent"(0.123 → 12.3%),"integer","volume" / "compact"(1,2 Tr),"price","number" |
每张表最多 100 个单元格。ctx.table(tên, null) 删除表格。
7.6. 已确认的高点、低点与标签
局部高点只有在其后有足够多更低的 K 线后才能确认。下例在 2n + 1 根 K 线的窗口中标记高点 / 低点,标签回退放在高点那根 K 线上(不偷看未来:标签在高点之后第 n 根 K 线出现):
indicator({
  name: "Đỉnh / đáy xác nhận",
  pane: "price",
  params: { n: param.int(5, { min: 2, max: 30, label: "Số nến mỗi bên" }) },
  limits: { labels: 300 },
  onBar: (ctx, s, p) => {
    if (ctx.i < 2 * p.n) return;
    const giua = ctx.bar(p.n);
    let dinh = true;
    let day = true;
    for (let k = 0; k <= 2 * p.n; k++) {
      if (k === p.n) continue;
      const b = ctx.bar(k);
      if (b.high >= giua.high) dinh = false;
      if (b.low <= giua.low) day = false;
    }
    if (dinh) ctx.draw.label({ at: { barsAgo: p.n, price: giua.high }, text: "Đ", style: "down", color: "down", size: "s" });
    if (day) ctx.draw.label({ at: { barsAgo: p.n, price: giua.low }, text: "Đáy", style: "up", color: "up", size: "s" });
  },
  plot: () => ({}),
});
练习
画一条连接最近两个已确认低点的线段(低点趋势线),并向右延伸。
答案
indicator({
  name: "Đường nối hai đáy gần nhất",
  pane: "price",
  params: { n: param.int(5, { min: 2, max: 30, label: "Số nến mỗi bên" }) },
  state: () => ({ days: [] }),
  onBar: (ctx, s, p) => {
    if (ctx.i < 2 * p.n) return;
    const giua = ctx.bar(p.n);
    let day = true;
    for (let k = 0; k <= 2 * p.n; k++) if (k !== p.n && ctx.bar(k).low <= giua.low) day = false;
    if (day) {
      s.days.push({ time: giua.time, price: giua.low });
      if (s.days.length > 2) s.days.shift();
    }
    if (s.days.length === 2) {
      ctx.draw.line({ id: "xu-huong-day", a: s.days[0], b: s.days[1], extend: "right", color: "up", width: 2 });
    }
  },
  plot: () => ({}),
});
{ time, price } 点按时间戳锚定到准确的 K 线,因此可以保存在状态中,并在之后的 K 线上复用。
下一课: 第 8 课 — 更大周期与其他数据