Bài 6 — Tính theo từng nến với onBar
- 🇻🇳 Tiếng Việt
- 🇬🇧 English
- 🇰🇷 한국어
- 🇨🇳 中文
Bạn sẽ học: viết logic chạy lần lượt qua từng nến, nhớ giá trị qua các nến (trạng thái), đưa kết quả lên biểu đồ, dùng chỉ báo trên số tự tính, đọc lại giá trị cũ của biến tự tính.
6.1. Khi nào cần onBar
Phần lớn chỉ báo viết được bằng phép của chuỗi (Bài 1–5). Dùng onBar khi giá trị của nến này phụ thuộc kết quả của chính nó ở nến trước theo cách các phép có sẵn không diễn tả được:
- đếm, cộng dồn có điều kiện, "kể từ khi…";
- đường dừng lỗ kéo theo chỉ đi một chiều, trạng thái xu hướng tăng / giảm tự định nghĩa;
- nến Heikin Ashi, Renko tự tính;
- vẽ nhãn, hộp, đường, bảng (Bài 7).
6.2. Khung của một chỉ báo onBar
indicator({
  name: "Tổng KL phiên tăng 10 nến",
  state: () => ({ ds: [] }),
  onBar: (ctx, s) => {
    s.ds.push(ctx.close > ctx.open ? ctx.volume : 0);
    if (s.ds.length > 10) s.ds.shift();
    let tong = 0;
    for (const v of s.ds) tong += v;
    return { tong };
  },
  plot: (d, p, o) => ({ "KL phiên tăng (10 nến)": columns(o.tong, { color: "up", format: "volume" }) }),
});
| Phần | Vai trò |
|---|---|
state: () => ({ … }) | Trạng thái ban đầu — đối tượng chứa những gì cần nhớ qua các nến. Chỉ chứa dữ liệu: số, chữ, mảng, đối tượng thường |
onBar: (ctx, s, p) => { … } | Chạy một lần cho mỗi nến, từ nến đầu tới nến cuối. ctx là nến đang tính, s là trạng thái (sửa trực tiếp), p là tham số |
return { tong } | Giá trị của nến này cho từng đầu ra onBar ({ tong } là cách viết gọn của { tong: tong }). Thiếu khoá → NaN |
plot: (d, p, o) => … | o chứa các đầu ra onBar dưới dạng chuỗi: o.tong. Vẽ như mọi chuỗi khác |
Giá trị onBar trả về chỉ hiện khi plot dùng nó qua o. Quên bước này, biểu đồ trống và trình soạn nhắc Script không vẽ gì. Chỉ trả plot: () => ({}) khi script vẽ toàn bộ bằng ctx.draw / ctx.table.
6.3. Những gì có trong ctx
| Thuộc tính | Nghĩa |
|---|---|
ctx.open, ctx.high, ctx.low, ctx.close, ctx.volume, ctx.time | Giá trị (số) của nến đang tính |
ctx.i | Số thứ tự nến (0 = nến đầu của dữ liệu đã nạp) |
ctx.bar(k) | OHLCV của nến k nến trước: ctx.bar(1).close là đóng cửa nến trước. k ≥ 0 |
ctx.closed | Nến đã đóng chưa (false ở nến đang chạy trong phiên) |
ctx.warmup | Nến thuộc đoạn khởi động (không hiện, không xét cảnh báo) |
ctx.realtime | Đang chạy theo giá realtime (không phải tính lại lịch sử) |
ctx.v.ten, ctx.prev("ten", k) | Giá trị của chuỗi khai báo trong series (6.4) |
ctx.ta.* | Chỉ báo trên số tự tính (6.5) |
ctx.track(key, giaTri) | Lịch sử của biến tự tính (6.6) |
ctx.draw, ctx.table, ctx.log, ctx.alert | Vẽ đối tượng, bảng, ghi nhật ký, bắn cảnh báo — Bài 7, Tham chiếu › onBar |
Trong onBar mọi thứ là số, nên dùng toán tử JavaScript bình thường: >, +, &&, Math.max(…).
6.4. Đưa chuỗi vào onBar
Tính đường trung bình bằng tay trong onBar vừa dài vừa chậm. Thay vào đó khai báo chuỗi trong series, rồi đọc giá trị của nến đang tính bằng ctx.v.<tên>:
indicator({
  name: "Số phiên liên tục trên EMA 20",
  series: (d) => ({ ema: ta.ema(d.close, 20) }),
  state: () => ({ dem: 0 }),
  onBar: (ctx, s) => {
    if (Number.isNaN(ctx.v.ema)) return;
    s.dem = ctx.close > ctx.v.ema ? s.dem + 1 : 0;
    return { dem: s.dem };
  },
  plot: (d, p, o) => ({ "Số phiên trên EMA 20": hist(o.dem, { color: "up" }) }),
});
series: (d, p) => ({ … })khai báo chuỗi đầu vào (dựng như trongplot).ctx.v.emalà giá trị EMA ở nến đang tính;ctx.prev("ema", 3)là giá trị 3 nến trước.return;(không trả gì) — nến đó mọi đầu ra là NaN.
6.5. Chỉ báo trên số tự tính: ctx.ta
ctx.ta.ema(giaTri, n) tính EMA của một con số bạn tự tính ở từng nến — kết quả trùng ta.ema nếu áp trên cùng chuỗi. Có sma, ema, rma, wma, rsi, stdev, sum, slope, highest, lowest, prev, change, cum, barsSince, crossAbove, crossBelow, cross, valueWhen, atr.
indicator({
  name: "Lực thân nến (EMA 10)",
  onBar: (ctx) => {
    const than = (ctx.close - ctx.open) / ctx.open * 100;
    const luc = ctx.ta.ema(than, 10);
    return { than, luc };
  },
  plot: (d, p, o) => ({
    "Thân nến %": hist(o.than, { up: "up", down: "down", opacity: 0.4 }),
    "EMA 10": line(o.luc, { color: "accent", width: 2 }),
  }),
});
Mỗi chỗ gọi ctx.ta.* là một bộ tính riêng, nhận ra theo thứ tự gọi trong một lượt onBar. Gọi trong if (nến gọi, nến không) làm lệch thứ tự và dừng với lỗi ctx.ta: lần gọi thứ … trước là …, nến này là … — gọi ctx.ta ở mọi nến theo cùng thứ tự, hoặc truyền key khi gọi trong nhánh. Cách sửa: gọi trước khi rẽ nhánh, hoặc truyền khoá riêng là đối số chữ cuối cùng: ctx.ta.ema(x, 10, "ema-tang").
indicator({
  name: "EMA riêng cho nến tăng và nến giảm",
  onBar: (ctx) => {
    let tang = NaN;
    let giam = NaN;
    if (ctx.close >= ctx.open) tang = ctx.ta.ema(ctx.volume, 10, "kl-tang");
    else giam = ctx.ta.ema(ctx.volume, 10, "kl-giam");
    return { tang, giam };
  },
  plot: (d, p, o) => ({
    "KL nến tăng (EMA)": line(o.tang.ffill(), { color: "up" }),
    "KL nến giảm (EMA)": line(o.giam.ffill(), { color: "down" }),
  }),
});
o.tang.ffill() lấp chỗ NaN bằng giá trị gần nhất trước đó để đường liền.
6.6. Đọc lại giá trị cũ của biến tự tính: ctx.track
ctx.track("ten", giaTri) ghi giá trị của nến này và trả lịch sử của biến: .at(0) là nến này, .at(3) là 3 nến trước (chưa có → NaN). Đây là cách viết x[3] cho một biến bạn tự tính.
indicator({
  name: "Động lượng của giá Heikin Ashi",
  state: () => ({ o: NaN, c: NaN }),
  onBar: (ctx, s) => {
    const c = (ctx.open + ctx.high + ctx.low + ctx.close) / 4;
    const o = Number.isNaN(s.o) ? (ctx.open + ctx.close) / 2 : (s.o + s.c) / 2;
    s.o = o;
    s.c = c;
    const lichSu = ctx.track("haClose", c);
    return { mom: c - lichSu.at(5) };
  },
  plot: (d, p, o) => ({
    "Động lượng HA (5)": hist(o.mom, { up: "up", down: "down" }),
  }),
});
ctx.track giữ 500 nến gần nhất cho mỗi biến (đủ cho mọi at(k) với k < 500).
6.7. Ví dụ hoàn chỉnh: dừng lỗ kéo theo ATR
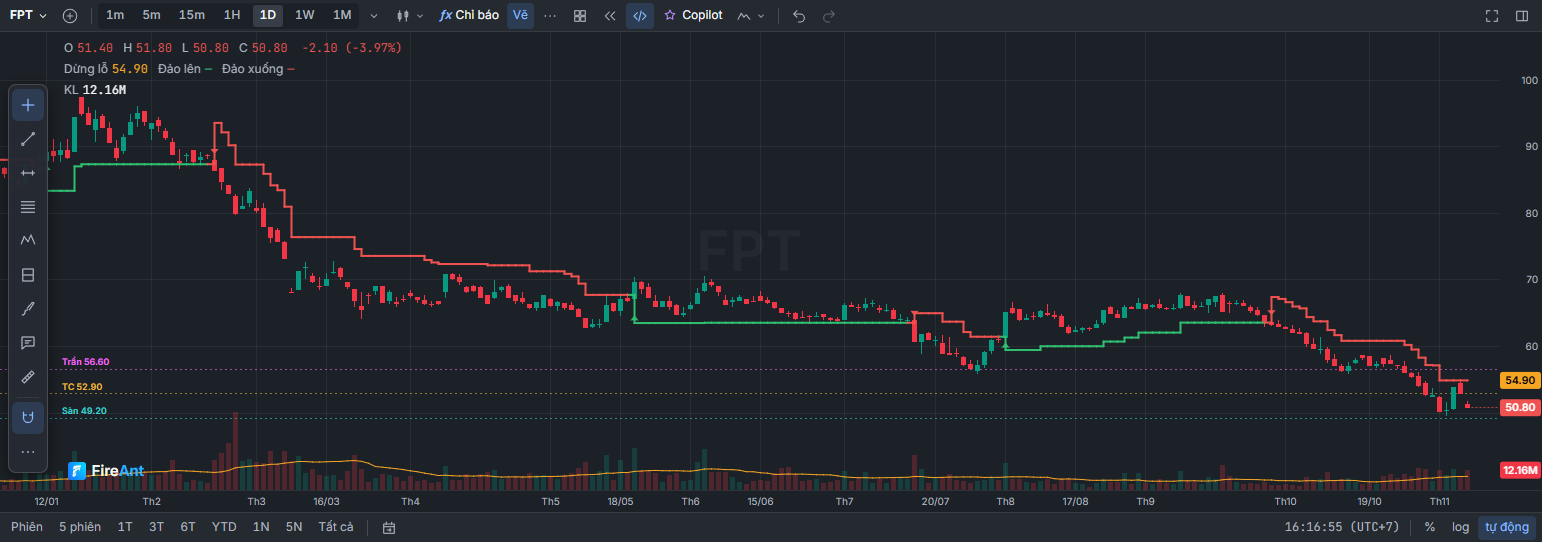
Một đường dừng lỗ đi theo giá: trong xu hướng tăng chỉ đi lên, nằm dưới giá mult × ATR; giá đóng cửa thủng đường thì đảo sang xu hướng giảm (đường nằm trên giá và chỉ đi xuống).
indicator({
  name: "Dừng lỗ kéo theo ATR",
  pane: "price",
  params: {
    n: param.int(14, { min: 2, max: 100, label: "Chu kỳ ATR" }),
    mult: param.num(3, { min: 1, max: 6, step: 0.5, label: "Hệ số ATR" }),
  },
  state: () => ({ stop: NaN, dir: 1 }),
  onBar: (ctx, s, p) => {
    const atr = ctx.ta.atr(p.n);
    if (Number.isNaN(atr)) return;
    if (s.dir > 0) {
      const moi = ctx.close - p.mult * atr;
      s.stop = Number.isNaN(s.stop) ? moi : Math.max(s.stop, moi);
      if (ctx.close < s.stop) {
        s.dir = -1;
        s.stop = ctx.close + p.mult * atr;
      }
    } else {
      s.stop = Math.min(s.stop, ctx.close + p.mult * atr);
      if (ctx.close > s.stop) {
        s.dir = 1;
        s.stop = ctx.close - p.mult * atr;
      }
    }
    return { stop: s.stop, dir: s.dir };
  },
  plot: (d, p, o) => ({
    "Dừng lỗ": line(o.stop, { width: 2, step: true, colors: [{ when: o.dir.gt(0), color: "up" }, { when: o.dir.lt(0), color: "down" }] }),
    "Đảo lên": shape(o.dir.crossAbove(0), { at: "below", shape: "arrowUp", color: "up" }),
    "Đảo xuống": shape(o.dir.crossBelow(0), { at: "above", shape: "arrowDown", color: "down" }),
  }),
});
ctx.ta.atr(n)là ATR (làm trơn Wilder) của khung đang tính, gọi ở mọi nến — đặt ở đầuonBartrước mọiif.- Đầu ra onBar (
o.dir) là chuỗi, nên dùng đượccrossAbove,colorsnhư mọi chuỗi.
6.8. Nến đang chạy, quay lui và trạng thái
Trên lịch sử, onBar chạy đúng một lần mỗi nến. Trong phiên, mỗi giá mới làm nến cuối được tính lại: onBar chạy lại trên bản sao trạng thái đã chốt ở nến trước — các thay đổi của lần chạy trước trên cùng nến bị bỏ. Nhờ vậy trạng thái không bị cộng dồn sai theo số lần khớp lệnh, và kết quả realtime trùng với kết quả tính lại cả lịch sử.
- Muốn một giá trị không bị quay lui (đếm số lần giá đổi trong nến, đo thời gian trong nến), dùng
ctx.persist("khoa", () => ({ … }))— đối tượng tạo một lần, giữ qua mọi lần chạy. ctx.closedcho biết lần chạy này là của nến đã đóng hay đang chạy.
Bài tập
Viết chỉ báo đếm số phiên kể từ đỉnh 52 tuần gần nhất (đỉnh = giá cao nhất 250 phiên), vẽ dạng cột.
Lời giải (onBar)
indicator({
  name: "Số phiên từ đỉnh 52 tuần",
  series: (d) => ({ dinh: d.high.highest(250) }),
  state: () => ({ tu: NaN }),
  onBar: (ctx, s) => {
    if (ctx.high >= ctx.v.dinh) s.tu = 0;
    else if (!Number.isNaN(s.tu)) s.tu += 1;
    return { tu: s.tu };
  },
  plot: (d, p, o) => ({ "Phiên từ đỉnh": columns(o.tu, { color: "accent" }) }),
});
Lời giải (không cần onBar)
indicator({
  name: "Số phiên từ đỉnh 52 tuần (chuỗi)",
  plot: (d) => ({
    "Phiên từ đỉnh": columns(d.high.gte(d.high.highest(250)).barsSince(), { color: "accent" }),
  }),
});
cond.barsSince() đếm số nến từ lần cond đúng gần nhất — thường có sẵn một phép chuỗi làm được việc tưởng phải dùng onBar.
Tiếp theo: Bài 7 — Vẽ nhãn, hộp, đường và bảng
You will learn: how to write logic that runs through candles one by one, remember values across candles (state), put the results on the chart, apply indicators to numbers you compute yourself, and read back past values of your own variables.
6.1. When you need onBar
Most indicators can be written with series operations (Lessons 1–5). Use onBar when a candle's value depends on its own result on the previous candle in a way the built-in operations cannot express:
- counting, conditional accumulation, "since…";
- trailing stop lines that only move one way, custom up / down trend states;
- Heikin Ashi or Renko candles computed by hand;
- drawing labels, boxes, lines and tables (Lesson 7).
6.2. The skeleton of an onBar indicator
indicator({
  name: "Tổng KL phiên tăng 10 nến",
  state: () => ({ ds: [] }),
  onBar: (ctx, s) => {
    s.ds.push(ctx.close > ctx.open ? ctx.volume : 0);
    if (s.ds.length > 10) s.ds.shift();
    let tong = 0;
    for (const v of s.ds) tong += v;
    return { tong };
  },
  plot: (d, p, o) => ({ "KL phiên tăng (10 nến)": columns(o.tong, { color: "up", format: "volume" }) }),
});
| Part | Role |
|---|---|
state: () => ({ … }) | Initial state — an object holding whatever must be remembered across candles. Data only: numbers, text, arrays, plain objects |
onBar: (ctx, s, p) => { … } | Runs once per candle, from the first candle to the last. ctx is the candle being calculated, s is the state (modify it directly), p is the parameters |
return { tong } | This candle's value for each onBar output ({ tong } is shorthand for { tong: tong }). A missing key → NaN |
plot: (d, p, o) => … | o holds the onBar outputs as series: o.tong. Draw them like any other series |
Values returned by onBar only appear when plot uses them through o. Forget this step and the chart stays empty, and the editor warns Script không vẽ gì (Script draws nothing). Return plot: () => ({}) only when the script draws everything with ctx.draw / ctx.table.
6.3. What ctx contains
| Property | Meaning |
|---|---|
ctx.open, ctx.high, ctx.low, ctx.close, ctx.volume, ctx.time | The values (numbers) of the candle being calculated |
ctx.i | The candle index (0 = the first candle of the loaded data) |
ctx.bar(k) | OHLCV of the candle k candles back: ctx.bar(1).close is the previous candle's close. k ≥ 0 |
ctx.closed | Whether the candle has closed (false for the live candle during a session) |
ctx.warmup | The candle belongs to the warm-up period (not displayed, no alerts evaluated) |
ctx.realtime | Running on real-time prices (not recalculating history) |
ctx.v.ten, ctx.prev("ten", k) | Values of the series declared in series (6.4) |
ctx.ta.* | Indicators on numbers you compute (6.5) |
ctx.track(key, giaTri) | History of a variable you compute (6.6) |
ctx.draw, ctx.table, ctx.log, ctx.alert | Draw objects, tables, write logs, fire alerts — Lesson 7, Reference › onBar |
Inside onBar everything is a number, so you use ordinary JavaScript operators: >, +, &&, Math.max(…).
6.4. Feeding series into onBar
Computing a moving average by hand in onBar is both long and slow. Instead, declare the series in series, then read its value for the current candle with ctx.v.<tên> (name):
indicator({
  name: "Số phiên liên tục trên EMA 20",
  series: (d) => ({ ema: ta.ema(d.close, 20) }),
  state: () => ({ dem: 0 }),
  onBar: (ctx, s) => {
    if (Number.isNaN(ctx.v.ema)) return;
    s.dem = ctx.close > ctx.v.ema ? s.dem + 1 : 0;
    return { dem: s.dem };
  },
  plot: (d, p, o) => ({ "Số phiên trên EMA 20": hist(o.dem, { color: "up" }) }),
});
series: (d, p) => ({ … })declares input series (built the same way as inplot).ctx.v.emais the EMA value on the current candle;ctx.prev("ema", 3)is the value 3 candles back.return;(returning nothing) — every output is NaN on that candle.
6.5. Indicators on numbers you compute: ctx.ta
ctx.ta.ema(giaTri, n) (value) computes the EMA of a number you compute on each candle — the result matches ta.ema when applied to the same series. Available: sma, ema, rma, wma, rsi, stdev, sum, slope, highest, lowest, prev, change, cum, barsSince, crossAbove, crossBelow, cross, valueWhen, atr.
indicator({
  name: "Lực thân nến (EMA 10)",
  onBar: (ctx) => {
    const than = (ctx.close - ctx.open) / ctx.open * 100;
    const luc = ctx.ta.ema(than, 10);
    return { than, luc };
  },
  plot: (d, p, o) => ({
    "Thân nến %": hist(o.than, { up: "up", down: "down", opacity: 0.4 }),
    "EMA 10": line(o.luc, { color: "accent", width: 2 }),
  }),
});
Each ctx.ta.* call site is a separate calculator, identified by its call order within one onBar pass. Calling it inside an if (called on some candles, not others) shifts the order and stops with the error ctx.ta: lần gọi thứ … trước là …, nến này là … — gọi ctx.ta ở mọi nến theo cùng thứ tự, hoặc truyền key khi gọi trong nhánh (ctx.ta: call #… was … before, … on this candle — call ctx.ta on every candle in the same order, or pass a key when calling inside a branch). The fix: call it before branching, or pass a unique key as the last text argument: ctx.ta.ema(x, 10, "ema-tang").
indicator({
  name: "EMA riêng cho nến tăng và nến giảm",
  onBar: (ctx) => {
    let tang = NaN;
    let giam = NaN;
    if (ctx.close >= ctx.open) tang = ctx.ta.ema(ctx.volume, 10, "kl-tang");
    else giam = ctx.ta.ema(ctx.volume, 10, "kl-giam");
    return { tang, giam };
  },
  plot: (d, p, o) => ({
    "KL nến tăng (EMA)": line(o.tang.ffill(), { color: "up" }),
    "KL nến giảm (EMA)": line(o.giam.ffill(), { color: "down" }),
  }),
});
o.tang.ffill() fills NaN gaps with the most recent previous value so the line is continuous.
6.6. Reading past values of your own variables: ctx.track
ctx.track("ten", giaTri) (name, value) records this candle's value and returns the variable's history: .at(0) is this candle, .at(3) is 3 candles back (not available yet → NaN). This is how you write x[3] for a variable you compute yourself.
indicator({
  name: "Động lượng của giá Heikin Ashi",
  state: () => ({ o: NaN, c: NaN }),
  onBar: (ctx, s) => {
    const c = (ctx.open + ctx.high + ctx.low + ctx.close) / 4;
    const o = Number.isNaN(s.o) ? (ctx.open + ctx.close) / 2 : (s.o + s.c) / 2;
    s.o = o;
    s.c = c;
    const lichSu = ctx.track("haClose", c);
    return { mom: c - lichSu.at(5) };
  },
  plot: (d, p, o) => ({
    "Động lượng HA (5)": hist(o.mom, { up: "up", down: "down" }),
  }),
});
ctx.track keeps the latest 500 candles for each variable (enough for any at(k) with k < 500).
6.7. A complete example: ATR trailing stop
A stop line that follows price: in an uptrend it only moves up, sitting mult × ATR below price; when the close breaks below the line, it flips to a downtrend (the line sits above price and only moves down).
indicator({
  name: "Dừng lỗ kéo theo ATR",
  pane: "price",
  params: {
    n: param.int(14, { min: 2, max: 100, label: "Chu kỳ ATR" }),
    mult: param.num(3, { min: 1, max: 6, step: 0.5, label: "Hệ số ATR" }),
  },
  state: () => ({ stop: NaN, dir: 1 }),
  onBar: (ctx, s, p) => {
    const atr = ctx.ta.atr(p.n);
    if (Number.isNaN(atr)) return;
    if (s.dir > 0) {
      const moi = ctx.close - p.mult * atr;
      s.stop = Number.isNaN(s.stop) ? moi : Math.max(s.stop, moi);
      if (ctx.close < s.stop) {
        s.dir = -1;
        s.stop = ctx.close + p.mult * atr;
      }
    } else {
      s.stop = Math.min(s.stop, ctx.close + p.mult * atr);
      if (ctx.close > s.stop) {
        s.dir = 1;
        s.stop = ctx.close - p.mult * atr;
      }
    }
    return { stop: s.stop, dir: s.dir };
  },
  plot: (d, p, o) => ({
    "Dừng lỗ": line(o.stop, { width: 2, step: true, colors: [{ when: o.dir.gt(0), color: "up" }, { when: o.dir.lt(0), color: "down" }] }),
    "Đảo lên": shape(o.dir.crossAbove(0), { at: "below", shape: "arrowUp", color: "up" }),
    "Đảo xuống": shape(o.dir.crossBelow(0), { at: "above", shape: "arrowDown", color: "down" }),
  }),
});
ctx.ta.atr(n)is the ATR (Wilder smoothing) of the current timeframe, called on every candle — put it at the top ofonBarbefore anyif.- An onBar output (
o.dir) is a series, so you can usecrossAboveandcolorson it like any other series.
6.8. The live candle, rollback and state
On history, onBar runs exactly once per candle. During a session, each new price causes the last candle to be recalculated: onBar reruns on a copy of the state committed at the previous candle — changes from earlier runs on the same candle are discarded. This keeps state from piling up incorrectly with the number of matched trades, and real-time results match a full recalculation of history.
- For a value that should not be rolled back (counting price changes within a candle, timing within a candle), use
ctx.persist("khoa", () => ({ … }))— the object is created once and kept across all runs. ctx.closedtells you whether this run is for a closed candle or the live one.
Exercise
Write an indicator that counts the number of sessions since the latest 52-week high (high = highest price of 250 sessions), drawn as columns.
Solution (onBar)
indicator({
  name: "Số phiên từ đỉnh 52 tuần",
  series: (d) => ({ dinh: d.high.highest(250) }),
  state: () => ({ tu: NaN }),
  onBar: (ctx, s) => {
    if (ctx.high >= ctx.v.dinh) s.tu = 0;
    else if (!Number.isNaN(s.tu)) s.tu += 1;
    return { tu: s.tu };
  },
  plot: (d, p, o) => ({ "Phiên từ đỉnh": columns(o.tu, { color: "accent" }) }),
});
Solution (no onBar needed)
indicator({
  name: "Số phiên từ đỉnh 52 tuần (chuỗi)",
  plot: (d) => ({
    "Phiên từ đỉnh": columns(d.high.gte(d.high.highest(250)).barsSince(), { color: "accent" }),
  }),
});
cond.barsSince() counts the candles since cond was last true — there is often a series operation that does what seems to require onBar.
배울 내용: 캔들을 하나씩 차례로 도는 로직 작성, 캔들을 넘어 값 기억하기(상태), 결과를 차트에 올리기, 직접 계산한 숫자에 지표 쓰기, 직접 계산한 변수의 과거 값 다시 읽기.
6.1. onBar가 필요한 때
대부분의 지표는 시계열 연산으로 작성할 수 있습니다(1–5강). 이번 캔들의 값이 내장 연산으로 표현할 수 없는 방식으로 이전 캔들에서 자기 자신의 결과에 의존할 때 onBar를 쓰세요.
- 세기, 조건부 누적, "… 이후로";
- 한 방향으로만 움직이는 추적 손절선, 직접 정의한 상승 / 하락 추세 상태;
- 직접 계산하는 Heikin Ashi, Renko 캔들;
- 라벨, 박스, 선, 표 그리기(7강).
6.2. onBar 지표의 뼈대
indicator({
  name: "Tổng KL phiên tăng 10 nến",
  state: () => ({ ds: [] }),
  onBar: (ctx, s) => {
    s.ds.push(ctx.close > ctx.open ? ctx.volume : 0);
    if (s.ds.length > 10) s.ds.shift();
    let tong = 0;
    for (const v of s.ds) tong += v;
    return { tong };
  },
  plot: (d, p, o) => ({ "KL phiên tăng (10 nến)": columns(o.tong, { color: "up", format: "volume" }) }),
});
| 부분 | 역할 |
|---|---|
state: () => ({ … }) | 초기 상태 — 캔들을 넘어 기억할 것을 담는 객체입니다. 데이터만 담습니다: 숫자, 문자열, 배열, 일반 객체 |
onBar: (ctx, s, p) => { … } | 첫 캔들부터 마지막 캔들까지 캔들마다 한 번 실행됩니다. ctx는 계산 중인 캔들, s는 상태(직접 수정), p는 매개변수 |
return { tong } | 각 onBar 출력에 대한 이번 캔들의 값({ tong }은 { tong: tong }의 축약형). 키가 없으면 → NaN |
plot: (d, p, o) => … | o에는 onBar 출력이 시계열 형태로 들어 있습니다: o.tong. 다른 시계열처럼 그립니다 |
onBar가 반환한 값은 plot이 o를 통해 사용할 때만 표시됩니다. 이 단계를 잊으면 차트가 비고 편집기가 Script không vẽ gì(스크립트가 아무것도 그리지 않음)라고 알려 줍니다. 스크립트가 모든 것을 ctx.draw / ctx.table로 그릴 때만 plot: () => ({})를 반환하세요.
6.3. ctx에 들어 있는 것
| 속성 | 의미 |
|---|---|
ctx.open, ctx.high, ctx.low, ctx.close, ctx.volume, ctx.time | 계산 중인 캔들의 값(숫자) |
ctx.i | 캔들 순번(0 = 불러온 데이터의 첫 캔들) |
ctx.bar(k) | k캔들 전 캔들의 OHLCV: ctx.bar(1).close는 이전 캔들의 종가. k ≥ 0 |
ctx.closed | 캔들이 마감되었는지(장중 진행 중인 캔들에서는 false) |
ctx.warmup | 워밍업 구간의 캔들인지(표시 안 함, 알림 판단 안 함) |
ctx.realtime | 실시간 가격으로 실행 중인지(과거 재계산이 아님) |
ctx.v.ten, ctx.prev("ten", k) | series에 선언한 시계열의 값(6.4) |
ctx.ta.* | 직접 계산한 숫자에 대한 지표(6.5) |
ctx.track(key, giaTri) | 직접 계산한 변수의 이력(6.6) |
ctx.draw, ctx.table, ctx.log, ctx.alert | 객체 그리기, 표, 로그 기록, 알림 발생 — 7강, 레퍼런스 › onBar |
onBar 안에서는 모든 것이 숫자이므로 일반 JavaScript 연산자를 씁니다: >, +, &&, Math.max(…).
6.4. 시계열을 onBar로 가져오기
onBar에서 이동평균을 직접 계산하면 길고 느립니다. 대신 series에 시계열을 선언하고, 계산 중인 캔들의 값을 ctx.v.<이름>으로 읽으세요.
indicator({
  name: "Số phiên liên tục trên EMA 20",
  series: (d) => ({ ema: ta.ema(d.close, 20) }),
  state: () => ({ dem: 0 }),
  onBar: (ctx, s) => {
    if (Number.isNaN(ctx.v.ema)) return;
    s.dem = ctx.close > ctx.v.ema ? s.dem + 1 : 0;
    return { dem: s.dem };
  },
  plot: (d, p, o) => ({ "Số phiên trên EMA 20": hist(o.dem, { color: "up" }) }),
});
series: (d, p) => ({ … })는 입력 시계열을 선언합니다(plot에서처럼 만듭니다).ctx.v.ema는 계산 중인 캔들의 EMA 값이고,ctx.prev("ema", 3)은 3캔들 전 값입니다.return;(아무것도 반환하지 않음) — 그 캔들의 모든 출력이 NaN이 됩니다.
6.5. 직접 계산한 숫자에 대한 지표: ctx.ta
ctx.ta.ema(giaTri, n)은 캔들마다 직접 계산한 숫자 하나의 EMA를 계산합니다. 같은 시계열에 적용하면 결과가 ta.ema와 같습니다. sma, ema, rma, wma, rsi, stdev, sum, slope, highest, lowest, prev, change, cum, barsSince, crossAbove, crossBelow, cross, valueWhen, atr이 있습니다.
indicator({
  name: "Lực thân nến (EMA 10)",
  onBar: (ctx) => {
    const than = (ctx.close - ctx.open) / ctx.open * 100;
    const luc = ctx.ta.ema(than, 10);
    return { than, luc };
  },
  plot: (d, p, o) => ({
    "Thân nến %": hist(o.than, { up: "up", down: "down", opacity: 0.4 }),
    "EMA 10": line(o.luc, { color: "accent", width: 2 }),
  }),
});
ctx.ta.*를 호출하는 각 위치는 별도의 계산기이며, onBar 한 번 실행 안에서의 호출 순서로 구별됩니다. if 안에서 호출하면(어떤 캔들은 호출하고 어떤 캔들은 안 함) 순서가 어긋나 ctx.ta: lần gọi thứ … trước là …, nến này là … — gọi ctx.ta ở mọi nến theo cùng thứ tự, hoặc truyền key khi gọi trong nhánh(ctx.ta: … 번째 호출이 이전에는 …, 이번 캔들은 … — 모든 캔들에서 같은 순서로 ctx.ta를 호출하거나, 분기 안에서 호출할 때는 key를 넘기세요) 오류로 멈춥니다. 고치는 법: 분기 전에 호출하거나, 마지막 문자열 인자로 고유한 키를 넘기세요: ctx.ta.ema(x, 10, "ema-tang").
indicator({
  name: "EMA riêng cho nến tăng và nến giảm",
  onBar: (ctx) => {
    let tang = NaN;
    let giam = NaN;
    if (ctx.close >= ctx.open) tang = ctx.ta.ema(ctx.volume, 10, "kl-tang");
    else giam = ctx.ta.ema(ctx.volume, 10, "kl-giam");
    return { tang, giam };
  },
  plot: (d, p, o) => ({
    "KL nến tăng (EMA)": line(o.tang.ffill(), { color: "up" }),
    "KL nến giảm (EMA)": line(o.giam.ffill(), { color: "down" }),
  }),
});
o.tang.ffill()은 NaN인 곳을 직전 값으로 채워 선이 이어지게 합니다.
6.6. 직접 계산한 변수의 과거 값 다시 읽기: ctx.track
ctx.track("ten", giaTri)는 이번 캔들의 값을 기록하고 변수의 이력을 반환합니다. .at(0)은 이번 캔들, .at(3)은 3캔들 전입니다(아직 없으면 → NaN). 직접 계산한 변수에 대해 x[3]을 쓰는 방법입니다.
indicator({
  name: "Động lượng của giá Heikin Ashi",
  state: () => ({ o: NaN, c: NaN }),
  onBar: (ctx, s) => {
    const c = (ctx.open + ctx.high + ctx.low + ctx.close) / 4;
    const o = Number.isNaN(s.o) ? (ctx.open + ctx.close) / 2 : (s.o + s.c) / 2;
    s.o = o;
    s.c = c;
    const lichSu = ctx.track("haClose", c);
    return { mom: c - lichSu.at(5) };
  },
  plot: (d, p, o) => ({
    "Động lượng HA (5)": hist(o.mom, { up: "up", down: "down" }),
  }),
});
ctx.track은 변수마다 최근 500캔들을 보관합니다(k < 500인 모든 at(k)에 충분).
6.7. 완성 예제: ATR 추적 손절
가격을 따라가는 손절선입니다. 상승 추세에서는 위로만 움직이며 가격 아래 mult × ATR에 있고, 종가가 선을 이탈하면 하락 추세로 전환합니다(선이 가격 위에 있고 아래로만 움직임).
indicator({
  name: "Dừng lỗ kéo theo ATR",
  pane: "price",
  params: {
    n: param.int(14, { min: 2, max: 100, label: "Chu kỳ ATR" }),
    mult: param.num(3, { min: 1, max: 6, step: 0.5, label: "Hệ số ATR" }),
  },
  state: () => ({ stop: NaN, dir: 1 }),
  onBar: (ctx, s, p) => {
    const atr = ctx.ta.atr(p.n);
    if (Number.isNaN(atr)) return;
    if (s.dir > 0) {
      const moi = ctx.close - p.mult * atr;
      s.stop = Number.isNaN(s.stop) ? moi : Math.max(s.stop, moi);
      if (ctx.close < s.stop) {
        s.dir = -1;
        s.stop = ctx.close + p.mult * atr;
      }
    } else {
      s.stop = Math.min(s.stop, ctx.close + p.mult * atr);
      if (ctx.close > s.stop) {
        s.dir = 1;
        s.stop = ctx.close - p.mult * atr;
      }
    }
    return { stop: s.stop, dir: s.dir };
  },
  plot: (d, p, o) => ({
    "Dừng lỗ": line(o.stop, { width: 2, step: true, colors: [{ when: o.dir.gt(0), color: "up" }, { when: o.dir.lt(0), color: "down" }] }),
    "Đảo lên": shape(o.dir.crossAbove(0), { at: "below", shape: "arrowUp", color: "up" }),
    "Đảo xuống": shape(o.dir.crossBelow(0), { at: "above", shape: "arrowDown", color: "down" }),
  }),
});
ctx.ta.atr(n)은 계산 중인 시간 프레임의 ATR(Wilder 평활)로, 모든 캔들에서 호출합니다. 모든if보다 앞,onBar맨 앞에 두세요.- onBar 출력(
o.dir)은 시계열이므로 다른 시계열처럼crossAbove,colors를 쓸 수 있습니다.
6.8. 진행 중인 캔들, 롤백, 상태
과거 데이터에서 onBar는 캔들마다 정확히 한 번 실행됩니다. 장중에는 새 가격마다 마지막 캔들이 다시 계산됩니다. onBar는 이전 캔들에서 확정된 상태의 사본으로 다시 실행되며, 같은 캔들에서 이전 실행이 만든 변경은 버려집니다. 덕분에 체결 횟수에 따라 상태가 잘못 누적되지 않고, 실시간 결과가 과거 전체를 다시 계산한 결과와 같습니다.
- 롤백되지 않는 값이 필요하면(캔들 안에서 가격이 바뀐 횟수 세기, 캔들 안의 시간 측정)
ctx.persist("khoa", () => ({ … }))를 쓰세요. 객체는 한 번 만들어지고 모든 실행에서 유지됩니다. ctx.closed는 이번 실행이 마감된 캔들의 것인지 진행 중인 캔들의 것인지 알려 줍니다.
유의 사항
- 상태에는 순수 데이터만 담고(함수,
Date불가), 최대 256 KB입니다. 긴 배열은 예제 6.2처럼 잘라 내세요. - 이후 캔들은 읽을 수 없습니다:
ctx.bar(-1),ctx.prev("x", -1),ctx.track("x").at(-1)은 không đọc được nến sau(이후 캔들을 읽을 수 없음) 오류를 냅니다. onBar가 있는 스크립트는 시계열만 쓰는 스크립트보다 느리고, 아직 Lọc bằng script(스크립트로 필터)에 쓸 수 없습니다. 필요할 때만 쓰세요.
연습 문제
가장 최근 52주 고점 이후 세션 수(고점 = 250세션 최고가)를 세는 지표를 작성하고 막대로 그리세요.
풀이(onBar)
indicator({
  name: "Số phiên từ đỉnh 52 tuần",
  series: (d) => ({ dinh: d.high.highest(250) }),
  state: () => ({ tu: NaN }),
  onBar: (ctx, s) => {
    if (ctx.high >= ctx.v.dinh) s.tu = 0;
    else if (!Number.isNaN(s.tu)) s.tu += 1;
    return { tu: s.tu };
  },
  plot: (d, p, o) => ({ "Phiên từ đỉnh": columns(o.tu, { color: "accent" }) }),
});
풀이(onBar 없이)
indicator({
  name: "Số phiên từ đỉnh 52 tuần (chuỗi)",
  plot: (d) => ({
    "Phiên từ đỉnh": columns(d.high.gte(d.high.highest(250)).barsSince(), { color: "accent" }),
  }),
});
cond.barsSince()는 cond가 가장 최근에 참이었던 때부터 캔들 수를 셉니다. onBar가 필요해 보이는 일도 대개 내장 시계열 연산으로 할 수 있습니다.
您将学到: 编写逐根 K 线依次运行的逻辑,跨 K 线记住数值(状态),把结果显示到图表上,对自行计算的数字使用指标,读回自算变量的历史值。
6.1. 何时需要 onBar
大多数指标都可以用序列运算写出来(第 1–5 课)。当本根 K 线的值取决于它自己在上一根 K 线上的结果,且现成运算无法表达时,才使用 onBar:
- 计数、有条件的累加、“自从……以来”;
- 只朝一个方向移动的跟踪止损线、自定义的上涨 / 下跌趋势状态;
- 自行计算的 Heikin Ashi、Renko K 线;
- 绘制标签、方框、线条、表格(第 7 课)。
6.2. onBar 指标的框架
indicator({
  name: "Tổng KL phiên tăng 10 nến",
  state: () => ({ ds: [] }),
  onBar: (ctx, s) => {
    s.ds.push(ctx.close > ctx.open ? ctx.volume : 0);
    if (s.ds.length > 10) s.ds.shift();
    let tong = 0;
    for (const v of s.ds) tong += v;
    return { tong };
  },
  plot: (d, p, o) => ({ "KL phiên tăng (10 nến)": columns(o.tong, { color: "up", format: "volume" }) }),
});
| 部分 | 作用 |
|---|---|
state: () => ({ … }) | 初始状态——存放需要跨 K 线记住的内容的对象。只能包含数据:数字、文字、数组、普通对象 |
onBar: (ctx, s, p) => { … } | 每根 K 线运行一次,从第一根到最后一根。ctx 是当前计算的 K 线,s 是状态(直接修改),p 是参数 |
return { tong } | 本根 K 线每个 onBar 输出的值({ tong } 是 { tong: tong } 的简写)。缺少键 → NaN |
plot: (d, p, o) => … | o 以序列形式包含各 onBar 输出:o.tong。像其他序列一样绘制 |
onBar 返回的值只有在 plot 通过 o 使用它时才会显示。忘了这一步,图表会是空的,编辑器会提示 Script không vẽ gì(脚本没有绘制任何内容)。只有当脚本完全用 ctx.draw / ctx.table 绘制时,才返回 plot: () => ({})。
6.3. ctx 中有什么
| 属性 | 含义 |
|---|---|
ctx.open, ctx.high, ctx.low, ctx.close, ctx.volume, ctx.time | 当前计算 K 线的值(数字) |
ctx.i | K 线序号(0 = 已加载数据的第一根 K 线) |
ctx.bar(k) | 往前第 k 根 K 线的 OHLCV:ctx.bar(1).close 是上一根 K 线的收盘价。k ≥ 0 |
ctx.closed | K 线是否已收盘(交易时段内正在形成的 K 线为 false) |
ctx.warmup | K 线属于预热段(不显示,不检查提醒) |
ctx.realtime | 正在按实时价格运行(而非重算历史) |
ctx.v.ten, ctx.prev("ten", k) | 在 series 中声明的序列的值(6.4) |
ctx.ta.* | 对自算数字使用的指标(6.5) |
ctx.track(key, giaTri) | 自算变量的历史(6.6) |
ctx.draw, ctx.table, ctx.log, ctx.alert | 绘制对象、表格、写日志、触发提醒——第 7 课,参考 › onBar |
在 onBar 中一切都是数字,所以直接使用普通 JavaScript 运算符:>、+、&&、Math.max(…)。
6.4. 把序列传入 onBar
在 onBar 中手工计算移动平均线既冗长又慢。改为在 series 中声明序列,然后用 ctx.v.<tên> 读取当前 K 线上的值:
indicator({
  name: "Số phiên liên tục trên EMA 20",
  series: (d) => ({ ema: ta.ema(d.close, 20) }),
  state: () => ({ dem: 0 }),
  onBar: (ctx, s) => {
    if (Number.isNaN(ctx.v.ema)) return;
    s.dem = ctx.close > ctx.v.ema ? s.dem + 1 : 0;
    return { dem: s.dem };
  },
  plot: (d, p, o) => ({ "Số phiên trên EMA 20": hist(o.dem, { color: "up" }) }),
});
series: (d, p) => ({ … })声明输入序列(构建方式与plot中相同)。ctx.v.ema是当前 K 线上的 EMA 值;ctx.prev("ema", 3)是 3 根 K 线之前的值。return;(不返回任何值)——该 K 线上所有输出都是 NaN。
6.5. 对自算数字使用指标:ctx.ta
ctx.ta.ema(giaTri, n) 计算您在每根 K 线上自行算出的数字的 EMA——如果作用于同一序列,结果与 ta.ema 相同。可用的有 sma、ema、rma、wma、rsi、stdev、sum、slope、highest、lowest、prev、change、cum、barsSince、crossAbove、crossBelow、cross、valueWhen、atr。
indicator({
  name: "Lực thân nến (EMA 10)",
  onBar: (ctx) => {
    const than = (ctx.close - ctx.open) / ctx.open * 100;
    const luc = ctx.ta.ema(than, 10);
    return { than, luc };
  },
  plot: (d, p, o) => ({
    "Thân nến %": hist(o.than, { up: "up", down: "down", opacity: 0.4 }),
    "EMA 10": line(o.luc, { color: "accent", width: 2 }),
  }),
});
每处 ctx.ta.* 调用都是一个独立的计算器,按一次 onBar 运行中的调用顺序识别。在 if 中调用(有的 K 线调用,有的不调用)会打乱顺序,并以错误 ctx.ta: lần gọi thứ … trước là …, nến này là … — gọi ctx.ta ở mọi nến theo cùng thứ tự, hoặc truyền key khi gọi trong nhánh(ctx.ta:第 … 次调用之前是 …,本根 K 线是 …——请在每根 K 线上按相同顺序调用 ctx.ta,或在分支中调用时传入 key)停止。修正方法:在分支之前调用,或把单独的键作为最后一个文字参数传入:ctx.ta.ema(x, 10, "ema-tang")。
indicator({
  name: "EMA riêng cho nến tăng và nến giảm",
  onBar: (ctx) => {
    let tang = NaN;
    let giam = NaN;
    if (ctx.close >= ctx.open) tang = ctx.ta.ema(ctx.volume, 10, "kl-tang");
    else giam = ctx.ta.ema(ctx.volume, 10, "kl-giam");
    return { tang, giam };
  },
  plot: (d, p, o) => ({
    "KL nến tăng (EMA)": line(o.tang.ffill(), { color: "up" }),
    "KL nến giảm (EMA)": line(o.giam.ffill(), { color: "down" }),
  }),
});
o.tang.ffill() 用之前最近的值填补 NaN,使线条连续。
6.6. 读回自算变量的历史值:ctx.track
ctx.track("ten", giaTri) 记录本根 K 线的值并返回该变量的历史:.at(0) 是本根,.at(3) 是 3 根之前(尚无 → NaN)。这就是对自算变量写 x[3] 的方式。
indicator({
  name: "Động lượng của giá Heikin Ashi",
  state: () => ({ o: NaN, c: NaN }),
  onBar: (ctx, s) => {
    const c = (ctx.open + ctx.high + ctx.low + ctx.close) / 4;
    const o = Number.isNaN(s.o) ? (ctx.open + ctx.close) / 2 : (s.o + s.c) / 2;
    s.o = o;
    s.c = c;
    const lichSu = ctx.track("haClose", c);
    return { mom: c - lichSu.at(5) };
  },
  plot: (d, p, o) => ({
    "Động lượng HA (5)": hist(o.mom, { up: "up", down: "down" }),
  }),
});
ctx.track 为每个变量保留最近 500 根 K 线(足够任何 k < 500 的 at(k))。
6.7. 完整示例:ATR 跟踪止损
一条跟随价格的止损线:在上升趋势中只向上移动,位于价格下方 mult × ATR;收盘价跌破该线时转为下降趋势(线位于价格上方且只向下移动)。
indicator({
  name: "Dừng lỗ kéo theo ATR",
  pane: "price",
  params: {
    n: param.int(14, { min: 2, max: 100, label: "Chu kỳ ATR" }),
    mult: param.num(3, { min: 1, max: 6, step: 0.5, label: "Hệ số ATR" }),
  },
  state: () => ({ stop: NaN, dir: 1 }),
  onBar: (ctx, s, p) => {
    const atr = ctx.ta.atr(p.n);
    if (Number.isNaN(atr)) return;
    if (s.dir > 0) {
      const moi = ctx.close - p.mult * atr;
      s.stop = Number.isNaN(s.stop) ? moi : Math.max(s.stop, moi);
      if (ctx.close < s.stop) {
        s.dir = -1;
        s.stop = ctx.close + p.mult * atr;
      }
    } else {
      s.stop = Math.min(s.stop, ctx.close + p.mult * atr);
      if (ctx.close > s.stop) {
        s.dir = 1;
        s.stop = ctx.close - p.mult * atr;
      }
    }
    return { stop: s.stop, dir: s.dir };
  },
  plot: (d, p, o) => ({
    "Dừng lỗ": line(o.stop, { width: 2, step: true, colors: [{ when: o.dir.gt(0), color: "up" }, { when: o.dir.lt(0), color: "down" }] }),
    "Đảo lên": shape(o.dir.crossAbove(0), { at: "below", shape: "arrowUp", color: "up" }),
    "Đảo xuống": shape(o.dir.crossBelow(0), { at: "above", shape: "arrowDown", color: "down" }),
  }),
});
ctx.ta.atr(n)是当前周期的 ATR(Wilder 平滑),需在每根 K 线上调用——放在onBar开头,任何if之前。- onBar 输出(
o.dir)是序列,因此可以像其他序列一样使用crossAbove、colors。
6.8. 正在形成的 K 线、回滚与状态
在历史数据上,onBar 每根 K 线恰好运行一次。交易时段内,每个新价格都会让最后一根 K 线重新计算:onBar 在上一根 K 线已确定状态的副本上重新运行——同一根 K 线上前一次运行所做的修改会被丢弃。这样,状态不会随成交次数被错误累加,实时结果也与重算整个历史的结果一致。
- 想让某个值不被回滚(统计 K 线内价格变动次数、测量 K 线内的时间),使用
ctx.persist("khoa", () => ({ … }))——该对象只创建一次,在所有运行中保留。 ctx.closed表示本次运行针对的是已收盘还是正在形成的 K 线。
练习
编写一个指标,统计距最近一次 52 周高点的交易时段数(高点 = 250 个交易时段的最高价),以柱状显示。
答案(onBar)
indicator({
  name: "Số phiên từ đỉnh 52 tuần",
  series: (d) => ({ dinh: d.high.highest(250) }),
  state: () => ({ tu: NaN }),
  onBar: (ctx, s) => {
    if (ctx.high >= ctx.v.dinh) s.tu = 0;
    else if (!Number.isNaN(s.tu)) s.tu += 1;
    return { tu: s.tu };
  },
  plot: (d, p, o) => ({ "Phiên từ đỉnh": columns(o.tu, { color: "accent" }) }),
});
答案(无需 onBar)
indicator({
  name: "Số phiên từ đỉnh 52 tuần (chuỗi)",
  plot: (d) => ({
    "Phiên từ đỉnh": columns(d.high.gte(d.high.highest(250)).barsSince(), { color: "accent" }),
  }),
});
cond.barsSince() 统计距 cond 最近一次成立的 K 线数——看似必须用 onBar 的事,通常都有现成的序列运算可以完成。