Bài 2 — Chỉ báo ngăn riêng và mức
- 🇻🇳 Tiếng Việt
- 🇬🇧 English
- 🇰🇷 한국어
- 🇨🇳 中文
Bạn sẽ học: vẽ chỉ báo ở ngăn riêng (RSI, MACD, Stochastic), cố định thang, kẻ mức ngang, tô vùng quá mua / quá bán, vẽ cột histogram hai màu, đặt nhiều ngăn trong một chỉ báo.
2.1. RSI ở ngăn riêng
indicator({
  name: "RSI của tôi",
  pane: "new",
  scale: { range: [0, 100], levels: [30, 70] },
  plot: (d) => ({
    RSI: line(ta.rsi(d.close, 14), { color: "accent", width: 2 }),
    "Quá mua": hline(70, { color: "down", dash: "dash" }),
    "Quá bán": hline(30, { color: "up", dash: "dash" }),
  }),
});
pane: "new"— ngăn riêng dưới biểu đồ giá (đây cũng là mặc định khi bỏpane).scale.range: [0, 100]— thang luôn từ 0 tới 100 thay vì tự co giãn theo dữ liệu;scale.levelskẻ thêm vạch mờ ở các mức.hline(giá trị, { … })— đường ngang cố định. Tuỳ chọn:color(mặc định xám),dash(mặc định nét gạch;"solid"để liền),width. Tên đầu ra ("Quá mua") hiện ở chú giải.
2.2. Tô vùng quá mua / quá bán
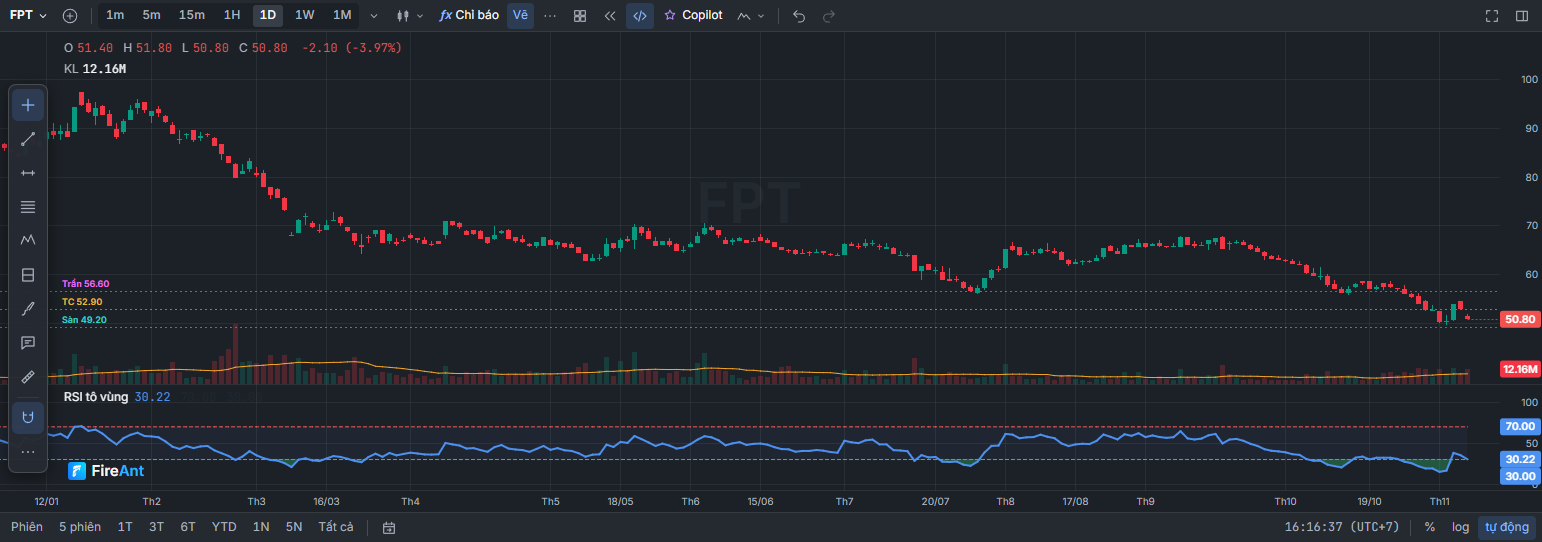
fill nhận tên của cả đường lẫn mức ngang. Mẹo: cho below trong suốt ("#00000000") để chỉ tô khi RSI vượt mức.
indicator({
  name: "RSI tô vùng",
  scale: { range: [0, 100] },
  plot: (d) => ({
    RSI: line(ta.rsi(d.close, 14), { color: "accent", width: 2 }),
    "70": hline(70, { color: "down" }),
    "30": hline(30, { color: "up" }),
    "Vùng giữa": band(70, 30, { color: "accent", opacity: 0.05 }),
    "Trên 70": fill("RSI", "70", { color: "down", below: "#00000000", opacity: 0.35 }),
    "Dưới 30": fill("30", "RSI", { color: "up", below: "#00000000", opacity: 0.35 }),
  }),
});
band(70, 30, …)— dải giữa hai số cố định (nền mờ cho vùng 30–70).fill("RSI", "70", …)tô giữa đường RSI và mức 70: màucolorkhi RSI trên 70; khi RSI dưới 70 dùngbelow(trong suốt).fill("30", "RSI", …)đảo thứ tự: tô khi 30 nằm trên RSI, tức RSI dưới 30.
2.3. MACD với histogram hai màu
ta.macd trả ba chuỗi trong một đối tượng: macd, signal, hist. hist(chuỗi, { up, down }) vẽ cột quanh 0: cột dương màu up, âm màu down.
indicator({
  name: "MACD của tôi",
  plot: (d) => {
    const m = ta.macd(d.close, 12, 26, 9);
    return {
      Histogram: hist(m.hist, { up: "up", down: "down", opacity: 0.6 }),
      MACD: line(m.macd, { color: "accent" }),
      "Tín hiệu": line(m.signal, { color: "ref" }),
      "0": hline(0, { color: "textMuted", dash: "dot" }),
    };
  },
});
Histogram bốn màu kiểu "tăng mạnh / tăng yếu / giảm yếu / giảm mạnh" dùng colors:
indicator({
  name: "MACD histogram 4 màu",
  plot: (d) => {
    const h = ta.macd(d.close).hist;
    const len = h.gt(h.shift(1));
    return {
      Histogram: hist(h, {
        color: "down",
        colors: [
          { when: h.gte(0).and(len), color: "up" },
          { when: h.gte(0), color: "#16C78480" },
          { when: len, color: "#F6465D80" },
        ],
      }),
    };
  },
});
ta.macd(d.close) không ghi số là dùng mặc định 12, 26, 9. Màu #16C78480 là xanh với độ đục 50 % (hai số cuối 80 là kênh trong suốt theo hệ 16).
2.4. Stochastic: hai đường và vùng giữa
indicator({
  name: "Stochastic 14-3-3",
  scale: { range: [0, 100], levels: [20, 80] },
  plot: (d) => {
    const st = ta.stoch(d, 14, 3, 3);
    return {
      "%K": line(st.k, { color: "accent" }),
      "%D": line(st.d, { color: "ref" }),
      "Khoảng K–D": fill("%K", "%D", { color: "up", below: "down", opacity: 0.15 }),
      "80": hline(80),
      "20": hline(20),
    };
  },
});
ta.stoch nhận cả d (vì cần cao, thấp, đóng) thay vì một chuỗi. Các chỉ báo cần nhiều giá — ta.atr, ta.adx, ta.cci, ta.mfi, ta.supertrend… — đều nhận d.
2.5. Nhiều ngăn trong một chỉ báo
Đặt pane cho từng đầu ra: cùng tên ngăn thì chung ngăn; "price" là ngăn giá.
indicator({
  name: "Khối lượng và OBV",
  plot: (d) => ({
    "Khối lượng": columns(d.volume, { color: "accent", opacity: 0.5, pane: "Khối lượng", format: "volume" }),
    "KL TB 20": line(ta.sma(d.volume, 20), { color: "ref", pane: "Khối lượng", format: "volume" }),
    OBV: line(ta.obv(d), { color: "ai", pane: "OBV", format: "compact" }),
  }),
});
columnsvẽ cột từ 0 (hợp với khối lượng);histvẽ cột quanh một mức gốcbase(mặc định 0) với hai màu tăng / giảm.formatđổi cách hiện số ở chú giải và thang:"volume"(1,2 Tr),"compact","percent","integer","price"…
Bài tập
- Vẽ CCI 20 ở ngăn riêng, mức +100 / −100, tô đỏ phần trên +100, xanh phần dưới −100.
- Vẽ %B của Bollinger (vị trí giá trong dải, 0 = dải dưới, 1 = dải trên) với mức 0 và 1.
Lời giải 1
indicator({
  name: "CCI tô vùng",
  plot: (d) => ({
    CCI: line(ta.cci(d, 20), { color: "accent" }),
    "+100": hline(100, { color: "down" }),
    "-100": hline(-100, { color: "up" }),
    "Trên +100": fill("CCI", "+100", { color: "down", below: "#00000000", opacity: 0.3 }),
    "Dưới -100": fill("-100", "CCI", { color: "up", below: "#00000000", opacity: 0.3 }),
  }),
});
Lời giải 2
indicator({
  name: "Bollinger %B",
  plot: (d) => ({
    "%B": line(ta.bb(d.close, 20, 2).pctB, { color: "accent" }),
    "Dải trên": hline(1, { color: "down" }),
    "Dải dưới": hline(0, { color: "up" }),
  }),
});
ta.bb trả upper, mid, lower, pctB, width — xem Tham chiếu › ta.
Tiếp theo: Bài 3 — Tín hiệu, mũi tên, tô màu
You will learn: how to draw indicators in a separate pane (RSI, MACD, Stochastic), fix the scale, draw horizontal levels, shade overbought / oversold zones, draw a two-color histogram, and put several panes in one indicator.
2.1. RSI in a separate pane
indicator({
  name: "RSI của tôi",
  pane: "new",
  scale: { range: [0, 100], levels: [30, 70] },
  plot: (d) => ({
    RSI: line(ta.rsi(d.close, 14), { color: "accent", width: 2 }),
    "Quá mua": hline(70, { color: "down", dash: "dash" }),
    "Quá bán": hline(30, { color: "up", dash: "dash" }),
  }),
});
pane: "new"— a separate pane below the price chart (also the default when you omitpane).scale.range: [0, 100]— the scale always runs from 0 to 100 instead of auto-fitting the data;scale.levelsadds faint gridlines at those levels.hline(giá trị, { … })(value) — a fixed horizontal line. Options:color(gray by default),dash(dashed by default;"solid"for a solid line),width. The output name ("Quá mua", overbought) appears in the legend.
2.2. Shading overbought / oversold zones
fill accepts the names of both lines and horizontal levels. Tip: make below transparent ("#00000000") so the area is shaded only when RSI crosses the level.
indicator({
  name: "RSI tô vùng",
  scale: { range: [0, 100] },
  plot: (d) => ({
    RSI: line(ta.rsi(d.close, 14), { color: "accent", width: 2 }),
    "70": hline(70, { color: "down" }),
    "30": hline(30, { color: "up" }),
    "Vùng giữa": band(70, 30, { color: "accent", opacity: 0.05 }),
    "Trên 70": fill("RSI", "70", { color: "down", below: "#00000000", opacity: 0.35 }),
    "Dưới 30": fill("30", "RSI", { color: "up", below: "#00000000", opacity: 0.35 }),
  }),
});
band(70, 30, …)— a band between two fixed numbers (a faint background for the 30–70 zone).fill("RSI", "70", …)shades between the RSI line and the 70 level:colorwhen RSI is above 70; when RSI is below 70,below(transparent) is used.fill("30", "RSI", …)reverses the order: it shades when 30 is above RSI, i.e. when RSI is below 30.
2.3. MACD with a two-color histogram
ta.macd returns three series in one object: macd, signal, hist. hist(chuỗi, { up, down }) (series) draws bars around 0: positive bars in the up color, negative bars in the down color.
indicator({
  name: "MACD của tôi",
  plot: (d) => {
    const m = ta.macd(d.close, 12, 26, 9);
    return {
      Histogram: hist(m.hist, { up: "up", down: "down", opacity: 0.6 }),
      MACD: line(m.macd, { color: "accent" }),
      "Tín hiệu": line(m.signal, { color: "ref" }),
      "0": hline(0, { color: "textMuted", dash: "dot" }),
    };
  },
});
A four-color histogram in the "strong up / weak up / weak down / strong down" style uses colors:
indicator({
  name: "MACD histogram 4 màu",
  plot: (d) => {
    const h = ta.macd(d.close).hist;
    const len = h.gt(h.shift(1));
    return {
      Histogram: hist(h, {
        color: "down",
        colors: [
          { when: h.gte(0).and(len), color: "up" },
          { when: h.gte(0), color: "#16C78480" },
          { when: len, color: "#F6465D80" },
        ],
      }),
    };
  },
});
ta.macd(d.close) without numbers uses the defaults 12, 26, 9. The color #16C78480 is green at 50% opacity (the last two digits, 80, are the hexadecimal alpha channel).
2.4. Stochastic: two lines and the area between them
indicator({
  name: "Stochastic 14-3-3",
  scale: { range: [0, 100], levels: [20, 80] },
  plot: (d) => {
    const st = ta.stoch(d, 14, 3, 3);
    return {
      "%K": line(st.k, { color: "accent" }),
      "%D": line(st.d, { color: "ref" }),
      "Khoảng K–D": fill("%K", "%D", { color: "up", below: "down", opacity: 0.15 }),
      "80": hline(80),
      "20": hline(20),
    };
  },
});
ta.stoch takes the whole d (because it needs high, low and close) rather than a single series. Indicators that need several prices — ta.atr, ta.adx, ta.cci, ta.mfi, ta.supertrend… — all take d.
2.5. Several panes in one indicator
Set pane on each output: outputs with the same pane name share a pane; "price" is the price pane.
indicator({
  name: "Khối lượng và OBV",
  plot: (d) => ({
    "Khối lượng": columns(d.volume, { color: "accent", opacity: 0.5, pane: "Khối lượng", format: "volume" }),
    "KL TB 20": line(ta.sma(d.volume, 20), { color: "ref", pane: "Khối lượng", format: "volume" }),
    OBV: line(ta.obv(d), { color: "ai", pane: "OBV", format: "compact" }),
  }),
});
columnsdraws bars from 0 (good for volume);histdraws bars around abaselevel (0 by default) in two colors for up / down.formatchanges how numbers are shown in the legend and scale:"volume"(1,2 Tr — i.e. 1.2 mn),"compact","percent","integer","price"…
Exercises
- Draw CCI 20 in a separate pane with levels +100 / −100, shading red above +100 and green below −100.
- Draw Bollinger %B (the price's position within the bands, 0 = lower band, 1 = upper band) with levels 0 and 1.
Solution 1
indicator({
  name: "CCI tô vùng",
  plot: (d) => ({
    CCI: line(ta.cci(d, 20), { color: "accent" }),
    "+100": hline(100, { color: "down" }),
    "-100": hline(-100, { color: "up" }),
    "Trên +100": fill("CCI", "+100", { color: "down", below: "#00000000", opacity: 0.3 }),
    "Dưới -100": fill("-100", "CCI", { color: "up", below: "#00000000", opacity: 0.3 }),
  }),
});
Solution 2
indicator({
  name: "Bollinger %B",
  plot: (d) => ({
    "%B": line(ta.bb(d.close, 20, 2).pctB, { color: "accent" }),
    "Dải trên": hline(1, { color: "down" }),
    "Dải dưới": hline(0, { color: "up" }),
  }),
});
ta.bb returns upper, mid, lower, pctB, width — see Reference › ta.
배울 내용: 별도 패널에 지표 그리기(RSI, MACD, Stochastic), 스케일 고정, 수평 수준선 긋기, 과매수 / 과매도 구간 칠하기, 두 색 히스토그램 막대 그리기, 한 지표에 여러 패널 두기.
2.1. 별도 패널의 RSI
indicator({
  name: "RSI của tôi",
  pane: "new",
  scale: { range: [0, 100], levels: [30, 70] },
  plot: (d) => ({
    RSI: line(ta.rsi(d.close, 14), { color: "accent", width: 2 }),
    "Quá mua": hline(70, { color: "down", dash: "dash" }),
    "Quá bán": hline(30, { color: "up", dash: "dash" }),
  }),
});
pane: "new"— 가격 차트 아래의 별도 패널(pane을 생략할 때의 기본값이기도 합니다).scale.range: [0, 100]— 데이터에 맞춰 자동으로 늘고 줄지 않고 스케일이 항상 0에서 100입니다.scale.levels는 해당 수준에 흐린 선을 추가로 긋습니다.hline(값, { … })— 고정 수평선입니다. 옵션:color(기본 회색),dash(기본 파선, 실선은"solid"),width. 출력 이름("Quá mua")은 범례에 표시됩니다.
2.2. 과매수 / 과매도 구간 칠하기
fill은 선과 수평 수준선의 이름을 모두 받습니다. 팁: below를 투명색("#00000000")으로 하면 RSI가 수준을 넘을 때만 칠해집니다.
indicator({
  name: "RSI tô vùng",
  scale: { range: [0, 100] },
  plot: (d) => ({
    RSI: line(ta.rsi(d.close, 14), { color: "accent", width: 2 }),
    "70": hline(70, { color: "down" }),
    "30": hline(30, { color: "up" }),
    "Vùng giữa": band(70, 30, { color: "accent", opacity: 0.05 }),
    "Trên 70": fill("RSI", "70", { color: "down", below: "#00000000", opacity: 0.35 }),
    "Dưới 30": fill("30", "RSI", { color: "up", below: "#00000000", opacity: 0.35 }),
  }),
});
band(70, 30, …)— 고정된 두 숫자 사이의 밴드(30–70 구간의 흐린 배경).fill("RSI", "70", …)은 RSI 선과 70 수준 사이를 칠합니다. RSI가 70 위면color, 70 아래면below(투명)를 씁니다.fill("30", "RSI", …)은 순서를 뒤집습니다. 30이 RSI 위에 있을 때, 즉 RSI가 30 아래일 때 칠합니다.
2.3. 두 색 히스토그램의 MACD
ta.macd는 객체 하나에 세 시계열 macd, signal, hist를 반환합니다. hist(시계열, { up, down })은 0을 중심으로 막대를 그립니다. 양수 막대는 up 색, 음수는 down 색입니다.
indicator({
  name: "MACD của tôi",
  plot: (d) => {
    const m = ta.macd(d.close, 12, 26, 9);
    return {
      Histogram: hist(m.hist, { up: "up", down: "down", opacity: 0.6 }),
      MACD: line(m.macd, { color: "accent" }),
      "Tín hiệu": line(m.signal, { color: "ref" }),
      "0": hline(0, { color: "textMuted", dash: "dot" }),
    };
  },
});
"강한 상승 / 약한 상승 / 약한 하락 / 강한 하락" 식의 네 색 히스토그램은 colors를 씁니다.
indicator({
  name: "MACD histogram 4 màu",
  plot: (d) => {
    const h = ta.macd(d.close).hist;
    const len = h.gt(h.shift(1));
    return {
      Histogram: hist(h, {
        color: "down",
        colors: [
          { when: h.gte(0).and(len), color: "up" },
          { when: h.gte(0), color: "#16C78480" },
          { when: len, color: "#F6465D80" },
        ],
      }),
    };
  },
});
숫자 없이 ta.macd(d.close)라고 쓰면 기본값 12, 26, 9를 씁니다. 색 #16C78480은 불투명도 50 %의 초록입니다(마지막 두 자리 80이 16진수 투명도 채널).
2.4. Stochastic: 두 선과 사이 영역
indicator({
  name: "Stochastic 14-3-3",
  scale: { range: [0, 100], levels: [20, 80] },
  plot: (d) => {
    const st = ta.stoch(d, 14, 3, 3);
    return {
      "%K": line(st.k, { color: "accent" }),
      "%D": line(st.d, { color: "ref" }),
      "Khoảng K–D": fill("%K", "%D", { color: "up", below: "down", opacity: 0.15 }),
      "80": hline(80),
      "20": hline(20),
    };
  },
});
ta.stoch는 시계열 하나가 아니라 d 전체를 받습니다(고가, 저가, 종가가 필요하기 때문). 여러 가격이 필요한 지표 — ta.atr, ta.adx, ta.cci, ta.mfi, ta.supertrend… — 는 모두 d를 받습니다.
2.5. 한 지표에 여러 패널
출력마다 pane을 지정합니다. 패널 이름이 같으면 같은 패널을 공유하고, "price"는 가격 패널입니다.
indicator({
  name: "Khối lượng và OBV",
  plot: (d) => ({
    "Khối lượng": columns(d.volume, { color: "accent", opacity: 0.5, pane: "Khối lượng", format: "volume" }),
    "KL TB 20": line(ta.sma(d.volume, 20), { color: "ref", pane: "Khối lượng", format: "volume" }),
    OBV: line(ta.obv(d), { color: "ai", pane: "OBV", format: "compact" }),
  }),
});
columns는 0에서부터 막대를 그립니다(거래량에 적합).hist는 기준 수준base(기본 0)를 중심으로 상승 / 하락 두 색 막대를 그립니다.format은 범례와 스케일의 숫자 표시 방식을 바꿉니다:"volume"(1,2 Tr),"compact","percent","integer","price"…
연습 문제
- 별도 패널에 CCI 20을 그리고, +100 / −100 수준선을 긋고, +100 위는 빨강, −100 아래는 초록으로 칠하세요.
- 볼린저 %B(밴드 안에서 가격의 위치, 0 = 하단 밴드, 1 = 상단 밴드)를 0과 1 수준선과 함께 그리세요.
풀이 1
indicator({
  name: "CCI tô vùng",
  plot: (d) => ({
    CCI: line(ta.cci(d, 20), { color: "accent" }),
    "+100": hline(100, { color: "down" }),
    "-100": hline(-100, { color: "up" }),
    "Trên +100": fill("CCI", "+100", { color: "down", below: "#00000000", opacity: 0.3 }),
    "Dưới -100": fill("-100", "CCI", { color: "up", below: "#00000000", opacity: 0.3 }),
  }),
});
풀이 2
indicator({
  name: "Bollinger %B",
  plot: (d) => ({
    "%B": line(ta.bb(d.close, 20, 2).pctB, { color: "accent" }),
    "Dải trên": hline(1, { color: "down" }),
    "Dải dưới": hline(0, { color: "up" }),
  }),
});
ta.bb는 upper, mid, lower, pctB, width를 반환합니다. 레퍼런스 › ta를 참고하세요.
다음: 3강 — 신호, 화살표, 색칠
您将学到: 在独立窗格中绘制指标(RSI、MACD、Stochastic),固定刻度,画水平线,填充超买 / 超卖区域,绘制双色柱状图(histogram),在一个指标中放置多个窗格。
2.1. 独立窗格中的 RSI
indicator({
  name: "RSI của tôi",
  pane: "new",
  scale: { range: [0, 100], levels: [30, 70] },
  plot: (d) => ({
    RSI: line(ta.rsi(d.close, 14), { color: "accent", width: 2 }),
    "Quá mua": hline(70, { color: "down", dash: "dash" }),
    "Quá bán": hline(30, { color: "up", dash: "dash" }),
  }),
});
pane: "new"— 价格图下方的独立窗格(省略pane时也是默认值)。scale.range: [0, 100]— 刻度始终为 0 到 100,而不是随数据自动缩放;scale.levels在这些水平位置额外画出淡色刻线。hline(giá trị, { … })— 固定水平线。选项:color(默认灰色)、dash(默认虚线;"solid"为实线)、width。输出名称("Quá mua")显示在图例中。
2.2. 填充超买 / 超卖区域
fill 既接受线的名称,也接受水平线的名称。技巧:把 below 设为透明("#00000000"),这样只在 RSI 越过水平线时填充。
indicator({
  name: "RSI tô vùng",
  scale: { range: [0, 100] },
  plot: (d) => ({
    RSI: line(ta.rsi(d.close, 14), { color: "accent", width: 2 }),
    "70": hline(70, { color: "down" }),
    "30": hline(30, { color: "up" }),
    "Vùng giữa": band(70, 30, { color: "accent", opacity: 0.05 }),
    "Trên 70": fill("RSI", "70", { color: "down", below: "#00000000", opacity: 0.35 }),
    "Dưới 30": fill("30", "RSI", { color: "up", below: "#00000000", opacity: 0.35 }),
  }),
});
band(70, 30, …)— 两个固定数字之间的带(30–70 区域的淡色背景)。fill("RSI", "70", …)填充 RSI 线与 70 水平线之间:RSI 在 70 上方时用color;RSI 在 70 下方时用below(透明)。fill("30", "RSI", …)顺序相反:当 30 位于 RSI 上方,即 RSI 低于 30 时填充。
2.3. 带双色柱状图的 MACD
ta.macd 在一个对象中返回三个序列:macd、signal、hist。hist(chuỗi, { up, down }) 围绕 0 绘制柱子:正值柱为 up 色,负值柱为 down 色。
indicator({
  name: "MACD của tôi",
  plot: (d) => {
    const m = ta.macd(d.close, 12, 26, 9);
    return {
      Histogram: hist(m.hist, { up: "up", down: "down", opacity: 0.6 }),
      MACD: line(m.macd, { color: "accent" }),
      "Tín hiệu": line(m.signal, { color: "ref" }),
      "0": hline(0, { color: "textMuted", dash: "dot" }),
    };
  },
});
“强涨 / 弱涨 / 弱跌 / 强跌”四色柱状图使用 colors:
indicator({
  name: "MACD histogram 4 màu",
  plot: (d) => {
    const h = ta.macd(d.close).hist;
    const len = h.gt(h.shift(1));
    return {
      Histogram: hist(h, {
        color: "down",
        colors: [
          { when: h.gte(0).and(len), color: "up" },
          { when: h.gte(0), color: "#16C78480" },
          { when: len, color: "#F6465D80" },
        ],
      }),
    };
  },
});
ta.macd(d.close) 不写参数时使用默认值 12、26、9。颜色 #16C78480 是不透明度 50% 的绿色(最后两位 80 是十六进制的透明通道)。
2.4. Stochastic:两条线及其间区域
indicator({
  name: "Stochastic 14-3-3",
  scale: { range: [0, 100], levels: [20, 80] },
  plot: (d) => {
    const st = ta.stoch(d, 14, 3, 3);
    return {
      "%K": line(st.k, { color: "accent" }),
      "%D": line(st.d, { color: "ref" }),
      "Khoảng K–D": fill("%K", "%D", { color: "up", below: "down", opacity: 0.15 }),
      "80": hline(80),
      "20": hline(20),
    };
  },
});
ta.stoch 接收整个 d(因为需要最高、最低、收盘价),而不是单个序列。需要多种价格的指标——ta.atr、ta.adx、ta.cci、ta.mfi、ta.supertrend…——都接收 d。
2.5. 一个指标中的多个窗格
为每个输出设置 pane:窗格名称相同则共用一个窗格;"price" 是价格窗格。
indicator({
  name: "Khối lượng và OBV",
  plot: (d) => ({
    "Khối lượng": columns(d.volume, { color: "accent", opacity: 0.5, pane: "Khối lượng", format: "volume" }),
    "KL TB 20": line(ta.sma(d.volume, 20), { color: "ref", pane: "Khối lượng", format: "volume" }),
    OBV: line(ta.obv(d), { color: "ai", pane: "OBV", format: "compact" }),
  }),
});
columns从 0 开始画柱(适合成交量);hist围绕基准值base(默认 0)画柱,并用涨 / 跌两种颜色。format改变图例和刻度上的数字显示方式:"volume"(1,2 Tr)、"compact"、"percent"、"integer"、"price"…
练习
- 在独立窗格中绘制 CCI 20,水平线 +100 / −100,+100 以上部分填充红色,−100 以下部分填充绿色。
- 绘制 Bollinger %B(价格在通道中的位置,0 = 下轨,1 = 上轨),带水平线 0 和 1。
答案 1
indicator({
  name: "CCI tô vùng",
  plot: (d) => ({
    CCI: line(ta.cci(d, 20), { color: "accent" }),
    "+100": hline(100, { color: "down" }),
    "-100": hline(-100, { color: "up" }),
    "Trên +100": fill("CCI", "+100", { color: "down", below: "#00000000", opacity: 0.3 }),
    "Dưới -100": fill("-100", "CCI", { color: "up", below: "#00000000", opacity: 0.3 }),
  }),
});
答案 2
indicator({
  name: "Bollinger %B",
  plot: (d) => ({
    "%B": line(ta.bb(d.close, 20, 2).pctB, { color: "accent" }),
    "Dải trên": hline(1, { color: "down" }),
    "Dải dưới": hline(0, { color: "up" }),
  }),
});
ta.bb 返回 upper、mid、lower、pctB、width——见参考 › ta。
下一课: 第 3 课 — 信号、箭头、着色