Bài 1 — Đường trung bình trên giá
- 🇻🇳 Tiếng Việt
- 🇬🇧 English
- 🇰🇷 한국어
- 🇨🇳 中文
Bạn sẽ học: vẽ đường trung bình đơn giản (SMA) và hàm mũ (EMA), chỉnh màu, độ dày, nét; đổi màu đường theo điều kiện; tô vùng giữa hai đường.
Cần biết trước: Script đầu tiên.
1.1. SMA và EMA
Đường trung bình làm mượt giá để thấy xu hướng. SMA (trung bình cộng) coi mọi nến như nhau; EMA (trung bình hàm mũ) coi nến gần đây nặng hơn nên bám giá nhanh hơn.
indicator({
  name: "SMA và EMA 20",
  pane: "price",
  plot: (d) => ({
    "SMA 20": line(ta.sma(d.close, 20), { color: "ref" }),
    "EMA 20": line(ta.ema(d.close, 20), { color: "accent" }),
  }),
});
ta.sma(chuỗi, n)vàta.ema(chuỗi, n)nhận một chuỗi và chu kỳn. Chuỗi thường làd.close, nhưng có thể là bất kỳ chuỗi nào:ta.sma(d.volume, 20)là khối lượng trung bình,ta.ema(d.hl2, 10)là EMA của giá giữa nến.- Cùng họ còn
ta.wma(trọng số tuyến tính),ta.hma(Hull — rất ít trễ),ta.rma(làm trơn Wilder, dùng trong RSI, ATR). Hơn chục loại khác (KAMA, ALMA, T3, McGinley…) gọi quata.run— xem Tham chiếu › ta.
1.2. Màu, độ dày, nét
indicator({
  name: "Ba đường trung bình",
  pane: "price",
  plot: (d) => ({
    "MA 20": line(ta.sma(d.close, 20), { color: "accent", width: 1 }),
    "MA 50": line(ta.sma(d.close, 50), { color: "ref", width: 2 }),
    "MA 200": line(ta.sma(d.close, 200), { color: "ceil", width: 3, dash: "dash" }),
  }),
});
| Tuỳ chọn | Giá trị | Nghĩa |
|---|---|---|
color | "up", "down", "accent", "ref", "ceil", "floor", "ai", "text", "textMuted", "palette.0"…"palette.5", "#RRGGBB" | Màu. Màu tên theo giao diện (đổi theo nền sáng / tối): tăng xanh, giảm đỏ, nhấn xanh dương, tham chiếu vàng, trần tím, sàn xanh lơ. Bỏ trống: màu tự chọn theo thứ tự |
width | số, mặc định 1,5 | Độ dày (điểm ảnh) |
dash | "solid", "dash", "dot" | Nét liền / gạch / chấm |
opacity | 0…1 | Độ đục (1 = đục hẳn) |
step | true | Vẽ bậc thang (hợp với mức hỗ trợ, trạng thái) |
points | "circles", "cross" | Vẽ chấm / chữ thập tại từng nến thay vì nối |
offset | số nến | Dời đường khi vẽ (dương sang phải) — chỉ ảnh hưởng hình, không ảnh hưởng tín hiệu |
hidden | true | Ẩn mặc định (vẫn có trong chú giải để bật lại) |
Bảng màu đầy đủ: Tham chiếu › Đầu ra.
1.3. Đổi màu theo điều kiện
colors là danh sách luật { when: điều kiện, color: màu }. Ở mỗi nến, luật đầu tiên có điều kiện đúng quyết định màu; không luật nào đúng thì dùng color.
indicator({
  name: "EMA đổi màu theo giá",
  pane: "price",
  params: { len: param.int(20, { min: 2, max: 200, label: "Chu kỳ" }) },
  plot: (d, p) => {
    const ema = ta.ema(d.close, p.len);
    return {
      EMA: line(ema, {
        color: "textMuted",
        width: 2,
        colors: [
          { when: d.close.gt(ema), color: "up" },
          { when: d.close.lt(ema), color: "down" },
        ],
      }),
    };
  },
});
Đường xanh khi giá đóng cửa trên EMA, đỏ khi dưới, xám khi bằng. Luật màu dùng được cho line, hist, area, shape, bgcolor, barcolor.
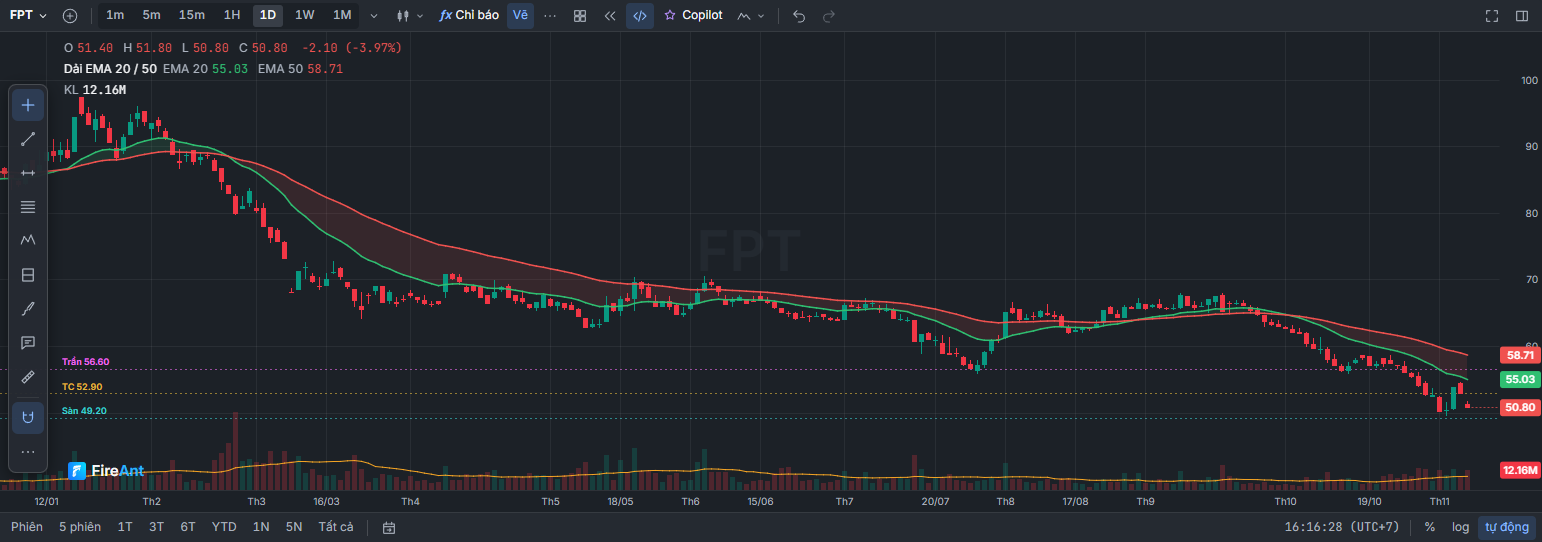
1.4. Tô vùng giữa hai đường
fill("Tên đầu ra A", "Tên đầu ra B", { … }) tô vùng giữa hai đầu ra theo tên (tên là khoá trong plot). below là màu khi A nằm dưới B — màu tự đổi tại điểm cắt.
indicator({
  name: "Dải EMA 20 / 50",
  pane: "price",
  plot: (d) => ({
    "EMA 20": line(ta.ema(d.close, 20), { color: "up" }),
    "EMA 50": line(ta.ema(d.close, 50), { color: "down" }),
    "Vùng": fill("EMA 20", "EMA 50", { color: "up", below: "down", opacity: 0.12 }),
  }),
});
fillđặt sau hai đầu ra nó nhắc tên.- Muốn một dải có cả hai đường biên trong một đầu ra, dùng
band(trên, dưới, { color, fill })— như kênh trung bình của giá cao nhất và thấp nhất:
indicator({
  name: "Kênh trung bình cao / thấp",
  pane: "price",
  params: { len: param.int(10, { min: 2, max: 100, label: "Chu kỳ" }) },
  plot: (d, p) => ({
    "Kênh": band(ta.sma(d.high, p.len), ta.sma(d.low, p.len), { color: "accent", opacity: 0.1 }),
    "Giữa": line(ta.sma(d.hl2, p.len), { color: "accent", dash: "dot" }),
  }),
});
1.5. Đường trung bình dời (displaced)
Một số phương pháp dời đường trung bình sang phải vài nến để lọc nhiễu. offset chỉ dời hình vẽ:
indicator({
  name: "SMA 20 dời 5 nến",
  pane: "price",
  plot: (d) => ({
    "SMA 20 dời": line(ta.sma(d.close, 20), { color: "ai", offset: 5 }),
  }),
});
Muốn dùng giá trị của 5 nến trước để tính (ví dụ so giá với đường đã dời), dùng ta.sma(d.close, 20).shift(5) — đó mới là chuỗi dời thật. offset âm (dời trái) chỉ là hình vẽ, không mang dữ liệu tương lai vào tín hiệu.
Bài tập
- Vẽ đường Hull MA 55 dày 2, màu tím trần.
- Vẽ EMA 34 của giá đóng cửa, tô xanh khi EMA đi lên so với nến trước, đỏ khi đi xuống.
- Vẽ "dải Guppy rút gọn": EMA 3, 5, 8 màu xanh, EMA 30, 35, 40 màu đỏ, nét mảnh.
Lời giải 1
indicator({
  name: "Hull MA 55",
  pane: "price",
  plot: (d) => ({ "HMA 55": line(ta.hma(d.close, 55), { color: "ceil", width: 2 }) }),
});
Lời giải 2
indicator({
  name: "EMA 34 theo chiều",
  pane: "price",
  plot: (d) => {
    const ema = ta.ema(d.close, 34);
    return {
      "EMA 34": line(ema, {
        width: 2,
        colors: [
          { when: ema.gt(ema.shift(1)), color: "up" },
          { when: ema.lt(ema.shift(1)), color: "down" },
        ],
      }),
    };
  },
});
ema.shift(1) là EMA của nến trước, nên ema.gt(ema.shift(1)) là "EMA đang đi lên".
Lời giải 3
indicator({
  name: "Guppy rút gọn",
  pane: "price",
  plot: (d) => ({
    "EMA 3": line(ta.ema(d.close, 3), { color: "up", width: 1 }),
    "EMA 5": line(ta.ema(d.close, 5), { color: "up", width: 1 }),
    "EMA 8": line(ta.ema(d.close, 8), { color: "up", width: 1 }),
    "EMA 30": line(ta.ema(d.close, 30), { color: "down", width: 1 }),
    "EMA 35": line(ta.ema(d.close, 35), { color: "down", width: 1 }),
    "EMA 40": line(ta.ema(d.close, 40), { color: "down", width: 1 }),
  }),
});
Bản đầy đủ 12 đường có sẵn: ta.run("gmma", {}) — xem Tham chiếu › ta.run.
Tiếp theo: Bài 2 — Chỉ báo ngăn riêng và mức
You will learn: how to draw a simple moving average (SMA) and an exponential moving average (EMA), set color, width and line style; change a line's color by condition; fill the area between two lines.
Prerequisites: Your first script.
1.1. SMA and EMA
A moving average smooths price so you can see the trend. The SMA (simple average) treats every candle equally; the EMA (exponential average) gives recent candles more weight, so it follows price more closely.
indicator({
  name: "SMA và EMA 20",
  pane: "price",
  plot: (d) => ({
    "SMA 20": line(ta.sma(d.close, 20), { color: "ref" }),
    "EMA 20": line(ta.ema(d.close, 20), { color: "accent" }),
  }),
});
ta.sma(chuỗi, n)andta.ema(chuỗi, n)take a series and a periodn. The series is usuallyd.close, but it can be any series:ta.sma(d.volume, 20)is the average volume,ta.ema(d.hl2, 10)is the EMA of the candle midpoint.- The same family also includes
ta.wma(linearly weighted),ta.hma(Hull — very little lag),ta.rma(Wilder smoothing, used in RSI and ATR). More than a dozen others (KAMA, ALMA, T3, McGinley…) are called throughta.run— see Reference › ta.
1.2. Color, width, line style
indicator({
  name: "Ba đường trung bình",
  pane: "price",
  plot: (d) => ({
    "MA 20": line(ta.sma(d.close, 20), { color: "accent", width: 1 }),
    "MA 50": line(ta.sma(d.close, 50), { color: "ref", width: 2 }),
    "MA 200": line(ta.sma(d.close, 200), { color: "ceil", width: 3, dash: "dash" }),
  }),
});
| Option | Values | Meaning |
|---|---|---|
color | "up", "down", "accent", "ref", "ceil", "floor", "ai", "text", "textMuted", "palette.0"…"palette.5", "#RRGGBB" | Color. Named colors follow the theme (they change with light / dark background): up is green, down is red, accent is blue, reference is yellow, ceiling is purple, floor is cyan. Leave empty: colors are picked automatically in order |
width | number, default 1.5 | Width (pixels) |
dash | "solid", "dash", "dot" | Solid / dashed / dotted |
opacity | 0…1 | Opacity (1 = fully opaque) |
step | true | Draw as steps (good for support levels, states) |
points | "circles", "cross" | Draw a dot / cross at each candle instead of a connected line |
offset | number of candles | Shifts the line when drawing (positive to the right) — affects only the picture, not signals |
hidden | true | Hidden by default (still listed in the legend so you can turn it back on) |
Full color palette: Reference › Outputs.
1.3. Changing color by condition
colors is a list of rules { when: điều kiện, color: màu } (condition, color). On each candle, the first rule whose condition is true decides the color; if no rule is true, color is used.
indicator({
  name: "EMA đổi màu theo giá",
  pane: "price",
  params: { len: param.int(20, { min: 2, max: 200, label: "Chu kỳ" }) },
  plot: (d, p) => {
    const ema = ta.ema(d.close, p.len);
    return {
      EMA: line(ema, {
        color: "textMuted",
        width: 2,
        colors: [
          { when: d.close.gt(ema), color: "up" },
          { when: d.close.lt(ema), color: "down" },
        ],
      }),
    };
  },
});
The line is green when the close is above the EMA, red when below, and gray when equal. Color rules work with line, hist, area, shape, bgcolor and barcolor.
1.4. Filling the area between two lines
fill("Tên đầu ra A", "Tên đầu ra B", { … }) fills the area between two outputs by name (the name is the key in plot). below is the color when A is below B — the color switches automatically at the crossover.
indicator({
  name: "Dải EMA 20 / 50",
  pane: "price",
  plot: (d) => ({
    "EMA 20": line(ta.ema(d.close, 20), { color: "up" }),
    "EMA 50": line(ta.ema(d.close, 50), { color: "down" }),
    "Vùng": fill("EMA 20", "EMA 50", { color: "up", below: "down", opacity: 0.12 }),
  }),
});
- Put
fillafter the two outputs it names. - For a band with both boundary lines in a single output, use
band(trên, dưới, { color, fill })(upper, lower) — like a channel of the average high and average low:
indicator({
  name: "Kênh trung bình cao / thấp",
  pane: "price",
  params: { len: param.int(10, { min: 2, max: 100, label: "Chu kỳ" }) },
  plot: (d, p) => ({
    "Kênh": band(ta.sma(d.high, p.len), ta.sma(d.low, p.len), { color: "accent", opacity: 0.1 }),
    "Giữa": line(ta.sma(d.hl2, p.len), { color: "accent", dash: "dot" }),
  }),
});
1.5. Displaced moving averages
Some methods shift a moving average a few candles to the right to filter noise. offset only shifts the drawing:
indicator({
  name: "SMA 20 dời 5 nến",
  pane: "price",
  plot: (d) => ({
    "SMA 20 dời": line(ta.sma(d.close, 20), { color: "ai", offset: 5 }),
  }),
});
To use the value from 5 candles ago in a calculation (for example, comparing price with the displaced line), use ta.sma(d.close, 20).shift(5) — that is the truly shifted series. A negative offset (shift left) is only a drawing; it does not bring future data into signals.
Exercises
- Draw a Hull MA 55 line, width 2, in the ceiling purple.
- Draw the EMA 34 of the close, colored green when the EMA rises versus the previous candle and red when it falls.
- Draw a "condensed Guppy ribbon": EMA 3, 5, 8 in green and EMA 30, 35, 40 in red, thin lines.
Solution 1
indicator({
  name: "Hull MA 55",
  pane: "price",
  plot: (d) => ({ "HMA 55": line(ta.hma(d.close, 55), { color: "ceil", width: 2 }) }),
});
Solution 2
indicator({
  name: "EMA 34 theo chiều",
  pane: "price",
  plot: (d) => {
    const ema = ta.ema(d.close, 34);
    return {
      "EMA 34": line(ema, {
        width: 2,
        colors: [
          { when: ema.gt(ema.shift(1)), color: "up" },
          { when: ema.lt(ema.shift(1)), color: "down" },
        ],
      }),
    };
  },
});
ema.shift(1) is the EMA of the previous candle, so ema.gt(ema.shift(1)) means "the EMA is rising".
Solution 3
indicator({
  name: "Guppy rút gọn",
  pane: "price",
  plot: (d) => ({
    "EMA 3": line(ta.ema(d.close, 3), { color: "up", width: 1 }),
    "EMA 5": line(ta.ema(d.close, 5), { color: "up", width: 1 }),
    "EMA 8": line(ta.ema(d.close, 8), { color: "up", width: 1 }),
    "EMA 30": line(ta.ema(d.close, 30), { color: "down", width: 1 }),
    "EMA 35": line(ta.ema(d.close, 35), { color: "down", width: 1 }),
    "EMA 40": line(ta.ema(d.close, 40), { color: "down", width: 1 }),
  }),
});
The full 12-line version is built in: ta.run("gmma", {}) — see Reference › ta.run.
배울 내용: 단순이동평균(SMA)과 지수이동평균(EMA) 그리기, 색·두께·선 모양 조정, 조건에 따라 선 색 바꾸기, 두 선 사이 영역 칠하기.
사전 지식: 첫 스크립트.
1.1. SMA와 EMA
이동평균은 가격을 부드럽게 만들어 추세를 보여 줍니다. SMA(단순평균)는 모든 캔들을 똑같이 취급하고, EMA(지수평균)는 최근 캔들에 더 큰 비중을 두어 가격을 더 빨리 따라갑니다.
indicator({
  name: "SMA và EMA 20",
  pane: "price",
  plot: (d) => ({
    "SMA 20": line(ta.sma(d.close, 20), { color: "ref" }),
    "EMA 20": line(ta.ema(d.close, 20), { color: "accent" }),
  }),
});
ta.sma(시계열, n)과ta.ema(시계열, n)은 시계열과 기간n을 받습니다. 시계열은 보통d.close지만 어떤 시계열이든 됩니다.ta.sma(d.volume, 20)은 평균 거래량,ta.ema(d.hl2, 10)은 캔들 중간 가격의 EMA입니다.- 같은 계열로
ta.wma(선형 가중),ta.hma(Hull — 지연이 매우 적음),ta.rma(Wilder 평활, RSI, ATR에 사용)가 있습니다. 그 밖에 십여 가지(KAMA, ALMA, T3, McGinley…)는ta.run으로 호출합니다. 레퍼런스 › ta를 참고하세요.
1.2. 색, 두께, 선 모양
indicator({
  name: "Ba đường trung bình",
  pane: "price",
  plot: (d) => ({
    "MA 20": line(ta.sma(d.close, 20), { color: "accent", width: 1 }),
    "MA 50": line(ta.sma(d.close, 50), { color: "ref", width: 2 }),
    "MA 200": line(ta.sma(d.close, 200), { color: "ceil", width: 3, dash: "dash" }),
  }),
});
| 옵션 | 값 | 의미 |
|---|---|---|
color | "up", "down", "accent", "ref", "ceil", "floor", "ai", "text", "textMuted", "palette.0"…"palette.5", "#RRGGBB" | 색. 이름 색은 화면 테마를 따릅니다(밝은 / 어두운 배경에 따라 변함): 상승 초록, 하락 빨강, 강조 파랑, 기준가 노랑, 상한가 보라, 하한가 하늘색. 비워 두면 순서대로 자동 선택 |
width | 숫자, 기본값 1.5 | 두께(픽셀) |
dash | "solid", "dash", "dot" | 실선 / 파선 / 점선 |
opacity | 0…1 | 불투명도(1 = 완전히 불투명) |
step | true | 계단식으로 그림(지지 수준, 상태에 적합) |
points | "circles", "cross" | 선으로 잇지 않고 캔들마다 점 / 십자로 그림 |
offset | 캔들 수 | 그릴 때 선을 이동(양수는 오른쪽) — 모양에만 영향, 신호에는 영향 없음 |
hidden | true | 기본으로 숨김(범례에 남아 있어 다시 켤 수 있음) |
전체 색상표: 레퍼런스 › 출력.
1.3. 조건에 따라 색 바꾸기
colors는 { when: 조건, color: 색 } 규칙의 목록입니다. 각 캔들에서 조건이 참인 첫 번째 규칙이 색을 정하고, 참인 규칙이 없으면 color를 씁니다.
indicator({
  name: "EMA đổi màu theo giá",
  pane: "price",
  params: { len: param.int(20, { min: 2, max: 200, label: "Chu kỳ" }) },
  plot: (d, p) => {
    const ema = ta.ema(d.close, p.len);
    return {
      EMA: line(ema, {
        color: "textMuted",
        width: 2,
        colors: [
          { when: d.close.gt(ema), color: "up" },
          { when: d.close.lt(ema), color: "down" },
        ],
      }),
    };
  },
});
종가가 EMA 위면 초록, 아래면 빨강, 같으면 회색 선이 됩니다. 색 규칙은 line, hist, area, shape, bgcolor, barcolor에 쓸 수 있습니다.
1.4. 두 선 사이 영역 칠하기
fill("출력 이름 A", "출력 이름 B", { … })는 두 출력 사이 영역을 이름으로 칠합니다(이름은 plot의 키). below는 A가 B 아래에 있을 때의 색이며, 교차점에서 색이 자동으로 바뀝니다.
indicator({
  name: "Dải EMA 20 / 50",
  pane: "price",
  plot: (d) => ({
    "EMA 20": line(ta.ema(d.close, 20), { color: "up" }),
    "EMA 50": line(ta.ema(d.close, 50), { color: "down" }),
    "Vùng": fill("EMA 20", "EMA 50", { color: "up", below: "down", opacity: 0.12 }),
  }),
});
fill은 이름을 언급하는 두 출력 뒤에 둡니다.- 위아래 경계선을 모두 한 출력에 담은 밴드를 원하면
band(위, 아래, { color, fill })를 씁니다. 예를 들어 고가와 저가의 평균 채널:
indicator({
  name: "Kênh trung bình cao / thấp",
  pane: "price",
  params: { len: param.int(10, { min: 2, max: 100, label: "Chu kỳ" }) },
  plot: (d, p) => ({
    "Kênh": band(ta.sma(d.high, p.len), ta.sma(d.low, p.len), { color: "accent", opacity: 0.1 }),
    "Giữa": line(ta.sma(d.hl2, p.len), { color: "accent", dash: "dot" }),
  }),
});
1.5. 이동된 이동평균선(displaced)
일부 기법은 노이즈를 거르기 위해 이동평균선을 몇 캔들 오른쪽으로 옮깁니다. offset은 그림만 옮깁니다.
indicator({
  name: "SMA 20 dời 5 nến",
  pane: "price",
  plot: (d) => ({
    "SMA 20 dời": line(ta.sma(d.close, 20), { color: "ai", offset: 5 }),
  }),
});
5캔들 전 값을 계산에 쓰려면(예: 가격을 이동된 선과 비교) ta.sma(d.close, 20).shift(5)를 쓰세요. 그것이 진짜 이동된 시계열입니다. 음수 offset(왼쪽 이동)은 그림일 뿐이며 미래 데이터를 신호에 가져오지 않습니다.
연습 문제
- 두께 2, 상한가 보라색으로 Hull MA 55 선을 그리세요.
- 종가의 EMA 34를 그리고, 이전 캔들보다 EMA가 오르면 초록, 내리면 빨강으로 칠하세요.
- "간소화한 Guppy 밴드"를 그리세요: EMA 3, 5, 8은 초록, EMA 30, 35, 40은 빨강, 가는 선.
풀이 1
indicator({
  name: "Hull MA 55",
  pane: "price",
  plot: (d) => ({ "HMA 55": line(ta.hma(d.close, 55), { color: "ceil", width: 2 }) }),
});
풀이 2
indicator({
  name: "EMA 34 theo chiều",
  pane: "price",
  plot: (d) => {
    const ema = ta.ema(d.close, 34);
    return {
      "EMA 34": line(ema, {
        width: 2,
        colors: [
          { when: ema.gt(ema.shift(1)), color: "up" },
          { when: ema.lt(ema.shift(1)), color: "down" },
        ],
      }),
    };
  },
});
ema.shift(1)은 이전 캔들의 EMA이므로 ema.gt(ema.shift(1))은 "EMA가 오르는 중"입니다.
풀이 3
indicator({
  name: "Guppy rút gọn",
  pane: "price",
  plot: (d) => ({
    "EMA 3": line(ta.ema(d.close, 3), { color: "up", width: 1 }),
    "EMA 5": line(ta.ema(d.close, 5), { color: "up", width: 1 }),
    "EMA 8": line(ta.ema(d.close, 8), { color: "up", width: 1 }),
    "EMA 30": line(ta.ema(d.close, 30), { color: "down", width: 1 }),
    "EMA 35": line(ta.ema(d.close, 35), { color: "down", width: 1 }),
    "EMA 40": line(ta.ema(d.close, 40), { color: "down", width: 1 }),
  }),
});
12개 선의 전체 버전이 내장되어 있습니다: ta.run("gmma", {}) — 레퍼런스 › ta.run을 참고하세요.
您将学到: 绘制简单移动平均线(SMA)和指数移动平均线(EMA),调整颜色、粗细、线型;按条件改变线的颜色;填充两条线之间的区域。
预备知识: 第一个脚本。
1.1. SMA 与 EMA
移动平均线让价格变得平滑,以便看清趋势。SMA(算术平均)对每根 K 线一视同仁;EMA(指数平均)让近期 K 线权重更大,因此更紧贴价格。
indicator({
  name: "SMA và EMA 20",
  pane: "price",
  plot: (d) => ({
    "SMA 20": line(ta.sma(d.close, 20), { color: "ref" }),
    "EMA 20": line(ta.ema(d.close, 20), { color: "accent" }),
  }),
});
ta.sma(chuỗi, n)和ta.ema(chuỗi, n)接收一个序列和周期n。序列通常是d.close,但可以是任何序列:ta.sma(d.volume, 20)是平均成交量,ta.ema(d.hl2, 10)是 K 线中间价的 EMA。- 同一家族还有
ta.wma(线性加权)、ta.hma(Hull——滞后极小)、ta.rma(Wilder 平滑,用于 RSI、ATR)。另外十多种(KAMA、ALMA、T3、McGinley…)通过ta.run调用——见参考 › ta。
1.2. 颜色、粗细、线型
indicator({
  name: "Ba đường trung bình",
  pane: "price",
  plot: (d) => ({
    "MA 20": line(ta.sma(d.close, 20), { color: "accent", width: 1 }),
    "MA 50": line(ta.sma(d.close, 50), { color: "ref", width: 2 }),
    "MA 200": line(ta.sma(d.close, 200), { color: "ceil", width: 3, dash: "dash" }),
  }),
});
| 选项 | 取值 | 含义 |
|---|---|---|
color | "up", "down", "accent", "ref", "ceil", "floor", "ai", "text", "textMuted", "palette.0"…"palette.5", "#RRGGBB" | 颜色。按界面命名的颜色(随浅色 / 深色背景变化):上涨绿、下跌红、强调蓝、参考黄、涨停紫、跌停青。留空:按顺序自动选色 |
width | 数字,默认 1.5 | 粗细(像素) |
dash | "solid", "dash", "dot" | 实线 / 虚线 / 点线 |
opacity | 0…1 | 不透明度(1 = 完全不透明) |
step | true | 绘制阶梯线(适合支撑位、状态) |
points | "circles", "cross" | 在每根 K 线上画圆点 / 十字,而非连线 |
offset | K 线数 | 绘制时平移线条(正数向右)——只影响图形,不影响信号 |
hidden | true | 默认隐藏(仍在图例中,可重新开启) |
完整调色板:参考 › 输出。
1.3. 按条件变色
colors 是一组规则 { when: điều kiện, color: màu }。在每根 K 线上,条件成立的第一条规则决定颜色;没有规则成立时使用 color。
indicator({
  name: "EMA đổi màu theo giá",
  pane: "price",
  params: { len: param.int(20, { min: 2, max: 200, label: "Chu kỳ" }) },
  plot: (d, p) => {
    const ema = ta.ema(d.close, p.len);
    return {
      EMA: line(ema, {
        color: "textMuted",
        width: 2,
        colors: [
          { when: d.close.gt(ema), color: "up" },
          { when: d.close.lt(ema), color: "down" },
        ],
      }),
    };
  },
});
收盘价在 EMA 上方时线为绿色,在下方时为红色,相等时为灰色。颜色规则可用于 line、hist、area、shape、bgcolor、barcolor。
1.4. 填充两条线之间的区域
fill("Tên đầu ra A", "Tên đầu ra B", { … }) 按名称填充两个输出之间的区域(名称即 plot 中的键)。below 是 A 在 B 下方时的颜色——颜色在交叉点自动切换。
indicator({
  name: "Dải EMA 20 / 50",
  pane: "price",
  plot: (d) => ({
    "EMA 20": line(ta.ema(d.close, 20), { color: "up" }),
    "EMA 50": line(ta.ema(d.close, 50), { color: "down" }),
    "Vùng": fill("EMA 20", "EMA 50", { color: "up", below: "down", opacity: 0.12 }),
  }),
});
fill要放在它所引用名称的两个输出之后。- 想在一个输出中得到带上下两条边界的通道,使用
band(trên, dưới, { color, fill })——例如最高价与最低价的平均通道:
indicator({
  name: "Kênh trung bình cao / thấp",
  pane: "price",
  params: { len: param.int(10, { min: 2, max: 100, label: "Chu kỳ" }) },
  plot: (d, p) => ({
    "Kênh": band(ta.sma(d.high, p.len), ta.sma(d.low, p.len), { color: "accent", opacity: 0.1 }),
    "Giữa": line(ta.sma(d.hl2, p.len), { color: "accent", dash: "dot" }),
  }),
});
1.5. 位移移动平均线(displaced)
一些方法会把移动平均线向右平移几根 K 线以过滤噪音。offset 只平移图形:
indicator({
  name: "SMA 20 dời 5 nến",
  pane: "price",
  plot: (d) => ({
    "SMA 20 dời": line(ta.sma(d.close, 20), { color: "ai", offset: 5 }),
  }),
});
想用 5 根 K 线之前的值来计算(例如拿价格与平移后的线比较),请使用 ta.sma(d.close, 20).shift(5)——这才是真正平移的序列。负的 offset(向左平移)只是图形,不会把未来数据带进信号。
练习
- 绘制 Hull MA 55,粗细 2,涨停紫色。
- 绘制收盘价的 EMA 34,EMA 相对上一根 K 线上升时为绿色,下降时为红色。
- 绘制“简化 Guppy 带”:EMA 3、5、8 为绿色,EMA 30、35、40 为红色,细线。
答案 1
indicator({
  name: "Hull MA 55",
  pane: "price",
  plot: (d) => ({ "HMA 55": line(ta.hma(d.close, 55), { color: "ceil", width: 2 }) }),
});
答案 2
indicator({
  name: "EMA 34 theo chiều",
  pane: "price",
  plot: (d) => {
    const ema = ta.ema(d.close, 34);
    return {
      "EMA 34": line(ema, {
        width: 2,
        colors: [
          { when: ema.gt(ema.shift(1)), color: "up" },
          { when: ema.lt(ema.shift(1)), color: "down" },
        ],
      }),
    };
  },
});
ema.shift(1) 是上一根 K 线的 EMA,所以 ema.gt(ema.shift(1)) 表示“EMA 正在上升”。
答案 3
indicator({
  name: "Guppy rút gọn",
  pane: "price",
  plot: (d) => ({
    "EMA 3": line(ta.ema(d.close, 3), { color: "up", width: 1 }),
    "EMA 5": line(ta.ema(d.close, 5), { color: "up", width: 1 }),
    "EMA 8": line(ta.ema(d.close, 8), { color: "up", width: 1 }),
    "EMA 30": line(ta.ema(d.close, 30), { color: "down", width: 1 }),
    "EMA 35": line(ta.ema(d.close, 35), { color: "down", width: 1 }),
    "EMA 40": line(ta.ema(d.close, 40), { color: "down", width: 1 }),
  }),
});
完整的 12 条线版本已内置:ta.run("gmma", {})——见参考 › ta.run。
下一课: 第 2 课 — 独立窗格指标与水平线