Bài 3 — Tín hiệu, mũi tên, tô màu
- 🇻🇳 Tiếng Việt
- 🇬🇧 English
- 🇰🇷 한국어
- 🇨🇳 中文
Bạn sẽ học: viết điều kiện (lớn hơn, cắt lên, kết hợp "và / hoặc"), đánh dấu bằng mũi tên / hình / ký tự, tô nền vùng thời gian, tô màu nến, và lọc để mỗi tín hiệu chỉ hiện một lần.
3.1. Điều kiện là một chuỗi 1 / 0
Mọi phép so sánh cho ra một chuỗi điều kiện: 1 ở nến đúng, 0 ở nến sai.
| Điều kiện | Viết |
|---|---|
| Giá đóng cửa trên MA 50 | d.close.gt(ta.sma(d.close, 50)) |
| RSI dưới 30 | ta.rsi(d.close, 14).lt(30) |
| RSI nằm trong 40–60 | ta.rsi(d.close, 14).between(40, 60) |
| EMA 20 cắt lên EMA 50 (nến trước ≤, nến này >) | ta.ema(d.close, 20).crossAbove(ta.ema(d.close, 50)) |
| Giá cắt xuống 100 | d.close.crossBelow(100) |
| Nến tăng | d.close.gt(d.open) |
| Khối lượng gấp đôi trung bình 20 | d.volume.gt(ta.sma(d.volume, 20).mul(2)) |
| Cả hai điều kiện | a.and(b) |
| Một trong hai | a.or(b) |
| Không phải | a.fillna(0).not() |
3.2. Mũi tên và hình
shape(điều kiện, { … }) vẽ một dấu ở mọi nến điều kiện đúng.
indicator({
  name: "Giá cắt MA 50",
  pane: "price",
  plot: (d) => {
    const ma = ta.sma(d.close, 50);
    return {
      "MA 50": line(ma, { color: "ref" }),
      "Cắt lên": shape(d.close.crossAbove(ma), { at: "below", shape: "arrowUp", color: "up", text: "Mua" }),
      "Cắt xuống": shape(d.close.crossBelow(ma), { at: "above", shape: "arrowDown", color: "down", text: "Bán" }),
    };
  },
});
| Tuỳ chọn | Giá trị |
|---|---|
at | "above" trên nến (mặc định), "below" dưới nến, "value" tại mức value, "top" / "bottom" mép trên / dưới ngăn |
shape | "triangleUp", "triangleDown", "arrowUp", "arrowDown", "circle", "square", "diamond", "flag", "label" |
char | Một ký tự thay hình, ví dụ "★", "B" |
text | Chữ ngắn kèm dấu |
color / colors | Màu / luật màu |
size | "s", "m", "l" |
value | Mức vẽ khi at: "value" (số hoặc chuỗi) |
Đặt dấu ngay tại một mức giá — ví dụ chấm tại đáy nến có bóng dưới dài:
indicator({
  name: "Bóng dưới dài",
  pane: "price",
  plot: (d) => {
    const than = d.close.sub(d.open).abs();
    const bongDuoi = d.open.min(d.close).sub(d.low);
    const dai = bongDuoi.gt(than.mul(2)).and(bongDuoi.gt(d.high.sub(d.low).mul(0.5)));
    return {
      "Bóng dưới dài": shape(dai, { at: "value", value: d.low, shape: "circle", color: "up", size: "s" }),
    };
  },
});
a.min(b) là giá trị nhỏ hơn của hai chuỗi ở từng nến — ở đây là cạnh dưới của thân nến.
3.3. Tô nền
bgcolor(điều kiện, { color, opacity }) tô cả cột nền của nến khi điều kiện đúng — hợp để thấy giai đoạn (xu hướng, vùng quá mua…).
indicator({
  name: "Nền theo MA 200",
  pane: "price",
  plot: (d) => {
    const ma = ta.sma(d.close, 200);
    return {
      "MA 200": line(ma, { color: "textMuted", width: 2 }),
      "Trên MA 200": bgcolor(d.close.gt(ma), { color: "up", opacity: 0.06 }),
      "Dưới MA 200": bgcolor(d.close.lt(ma), { color: "down", opacity: 0.06 }),
    };
  },
});
Với chỉ báo ngăn riêng, bgcolor tô nền của ngăn đó; muốn tô ngăn giá thì thêm pane: "price" vào tuỳ chọn của đầu ra.
3.4. Tô màu nến
barcolor(điều kiện, { color }) tô lại chính nến giá khi điều kiện đúng:
indicator({
  name: "Nến khối lượng đột biến",
  pane: "price",
  params: { mult: param.num(2, { min: 1.2, max: 10, step: 0.1, label: "Gấp mấy lần TB 20" }) },
  plot: (d, p) => {
    const dotBien = d.volume.gt(ta.sma(d.volume, 20).mul(p.mult));
    return {
      "Đột biến tăng": barcolor(dotBien.and(d.close.gt(d.open)), { color: "ai" }),
      "Đột biến giảm": barcolor(dotBien.and(d.close.lt(d.open)), { color: "ref" }),
    };
  },
});
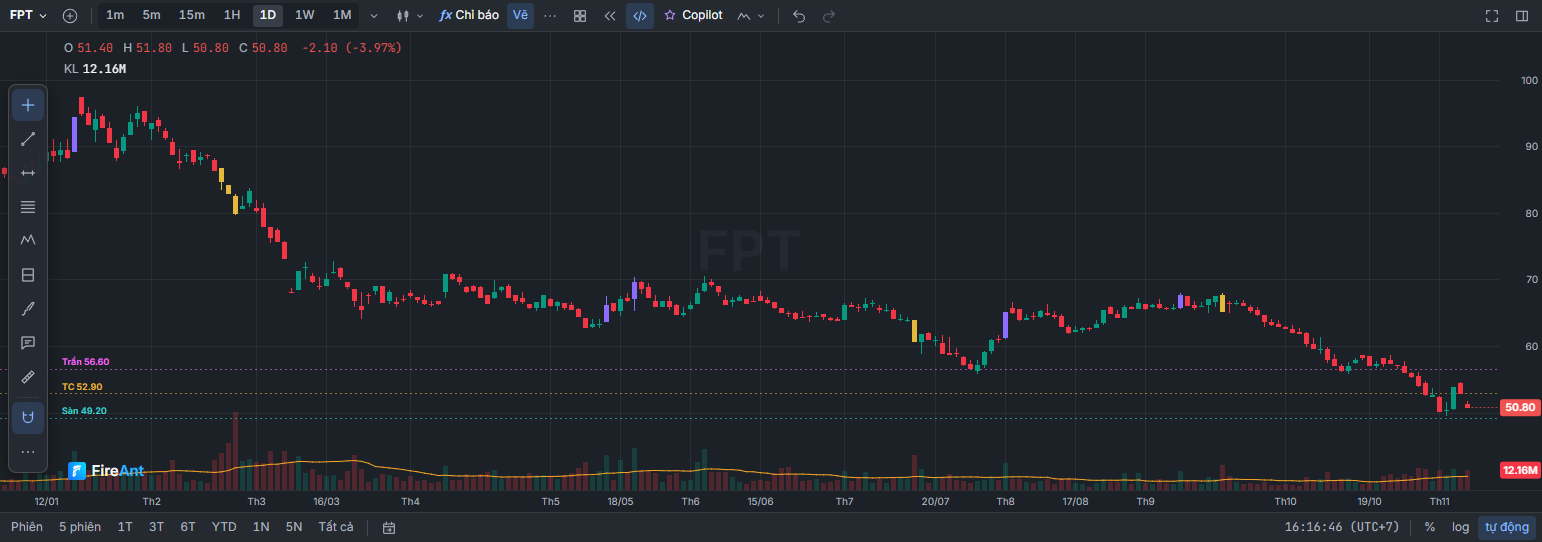
3.5. Mỗi tín hiệu chỉ một lần
Điều kiện kiểu "RSI dưới 30" đúng nhiều nến liền, nên dấu dày đặc. Ba cách lọc:
| Muốn | Viết |
|---|---|
| Chỉ nến đầu tiên điều kiện đúng | cond.and(cond.shift(1).fillna(0).not()) — hoặc dùng crossAbove / crossBelow nếu là vượt mức |
| Không báo lại trong N nến | cond.and(cond.shift(1).hold(N).fillna(0).not()) |
| Đã bao lâu từ lần đúng gần nhất | cond.barsSince() (số nến; chưa từng đúng → NaN) |
indicator({
  name: "Vào vùng quá bán (lần đầu)",
  pane: "new",
  scale: { range: [0, 100] },
  plot: (d) => {
    const r = ta.rsi(d.close, 14);
    const quaBan = r.lt(30);
    const lanDau = quaBan.and(quaBan.shift(1).fillna(0).not());
    return {
      RSI: line(r, { color: "accent" }),
      "30": hline(30, { color: "up" }),
      "Vào quá bán": shape(lanDau, { at: "bottom", shape: "triangleUp", color: "up" }),
    };
  },
});
x.hold(n) giữ trạng thái đúng thêm n nến sau mỗi lần đúng; vì thế cond.shift(1).hold(N) đúng nếu cond đã đúng trong N + 1 nến trước — đảo lại là "không báo lại trong khoảng đó".
3.6. Tự định nghĩa mẫu nến
Mẫu nến nhấn chìm tăng: nến trước giảm, nến này tăng và thân nến này bao trùm thân nến trước.
indicator({
  name: "Nhấn chìm tăng / giảm",
  pane: "price",
  plot: (d) => {
    const o1 = d.open.shift(1), c1 = d.close.shift(1);
    const tang = c1.lt(o1).and(d.close.gt(d.open)).and(d.close.gte(o1)).and(d.open.lte(c1));
    const giam = c1.gt(o1).and(d.close.lt(d.open)).and(d.close.lte(o1)).and(d.open.gte(c1));
    return {
      "Nhấn chìm tăng": shape(tang, { at: "below", shape: "triangleUp", color: "up" }),
      "Nhấn chìm giảm": shape(giam, { at: "above", shape: "triangleDown", color: "down" }),
    };
  },
});
Thư viện dựng sẵn hơn 30 mẫu nến (búa, sao mai, ba chàng lính…): ta.run("candle-patterns", {}) trả bull, bear, neutral — xem Thư viện mẫu › Mẫu nến.
Bài tập
- Đánh dấu ★ trên nến khi giá đóng cửa cao nhất 52 phiên (đỉnh mới 52 tuần trên nến ngày).
- Tô nền vàng nhạt khi dải Bollinger 20 hẹp nhất 100 nến.
Lời giải 1
indicator({
  name: "Đỉnh mới 52 tuần",
  pane: "price",
  plot: (d) => ({
    "Đỉnh mới": shape(d.close.gte(d.close.highest(250)), { at: "above", char: "★", color: "ref" }),
  }),
});
x.highest(n) là giá trị lớn nhất của n nến gần nhất kể cả nến này — nên "bằng cao nhất" nghĩa là nến này lập đỉnh.
Lời giải 2
indicator({
  name: "Bollinger hẹp nhất",
  pane: "price",
  plot: (d) => {
    const w = ta.bb(d.close, 20, 2).width;
    return { "Nén": bgcolor(w.lte(w.lowest(100)), { color: "ref", opacity: 0.12 }) };
  },
});
Tiếp theo: Bài 4 — Tham số chỉnh được
You will learn: how to write conditions (greater than, crosses above, combining "and / or"), mark them with arrows / shapes / characters, shade background periods, color candles, and filter so each signal appears only once.
3.1. A condition is a 1 / 0 series
Every comparison produces a condition series: 1 on candles where it is true, 0 where it is false.
| Condition | Code |
|---|---|
| Close above MA 50 | d.close.gt(ta.sma(d.close, 50)) |
| RSI below 30 | ta.rsi(d.close, 14).lt(30) |
| RSI between 40 and 60 | ta.rsi(d.close, 14).between(40, 60) |
| EMA 20 crosses above EMA 50 (previous candle ≤, this candle >) | ta.ema(d.close, 20).crossAbove(ta.ema(d.close, 50)) |
| Price crosses below 100 | d.close.crossBelow(100) |
| Up candle | d.close.gt(d.open) |
| Volume twice the 20-session average | d.volume.gt(ta.sma(d.volume, 20).mul(2)) |
| Both conditions | a.and(b) |
| Either one | a.or(b) |
| Not | a.fillna(0).not() |
3.2. Arrows and shapes
shape(điều kiện, { … }) (condition) draws a marker on every candle where the condition is true.
indicator({
  name: "Giá cắt MA 50",
  pane: "price",
  plot: (d) => {
    const ma = ta.sma(d.close, 50);
    return {
      "MA 50": line(ma, { color: "ref" }),
      "Cắt lên": shape(d.close.crossAbove(ma), { at: "below", shape: "arrowUp", color: "up", text: "Mua" }),
      "Cắt xuống": shape(d.close.crossBelow(ma), { at: "above", shape: "arrowDown", color: "down", text: "Bán" }),
    };
  },
});
| Option | Values |
|---|---|
at | "above" above the candle (default), "below" below the candle, "value" at the value level, "top" / "bottom" top / bottom edge of the pane |
shape | "triangleUp", "triangleDown", "arrowUp", "arrowDown", "circle", "square", "diamond", "flag", "label" |
char | A single character instead of a shape, for example "★", "B" |
text | Short text attached to the marker |
color / colors | Color / color rules |
size | "s", "m", "l" |
value | The level to draw at when at: "value" (a number or a series) |
Place the marker right at a price level — for example, a dot at the low of a candle with a long lower shadow:
indicator({
  name: "Bóng dưới dài",
  pane: "price",
  plot: (d) => {
    const than = d.close.sub(d.open).abs();
    const bongDuoi = d.open.min(d.close).sub(d.low);
    const dai = bongDuoi.gt(than.mul(2)).and(bongDuoi.gt(d.high.sub(d.low).mul(0.5)));
    return {
      "Bóng dưới dài": shape(dai, { at: "value", value: d.low, shape: "circle", color: "up", size: "s" }),
    };
  },
});
a.min(b) is the smaller of the two series on each candle — here, the bottom edge of the candle body.
3.3. Background shading
bgcolor(điều kiện, { color, opacity }) (condition) shades the whole background column of the candle when the condition is true — good for seeing phases (trend, overbought zone…).
indicator({
  name: "Nền theo MA 200",
  pane: "price",
  plot: (d) => {
    const ma = ta.sma(d.close, 200);
    return {
      "MA 200": line(ma, { color: "textMuted", width: 2 }),
      "Trên MA 200": bgcolor(d.close.gt(ma), { color: "up", opacity: 0.06 }),
      "Dưới MA 200": bgcolor(d.close.lt(ma), { color: "down", opacity: 0.06 }),
    };
  },
});
For a separate-pane indicator, bgcolor shades the background of that pane; to shade the price pane, add pane: "price" to the output's options.
3.4. Coloring candles
barcolor(điều kiện, { color }) (condition) recolors the price candle itself when the condition is true:
indicator({
  name: "Nến khối lượng đột biến",
  pane: "price",
  params: { mult: param.num(2, { min: 1.2, max: 10, step: 0.1, label: "Gấp mấy lần TB 20" }) },
  plot: (d, p) => {
    const dotBien = d.volume.gt(ta.sma(d.volume, 20).mul(p.mult));
    return {
      "Đột biến tăng": barcolor(dotBien.and(d.close.gt(d.open)), { color: "ai" }),
      "Đột biến giảm": barcolor(dotBien.and(d.close.lt(d.open)), { color: "ref" }),
    };
  },
});
3.5. Each signal only once
A condition like "RSI below 30" is true for many candles in a row, so markers pile up. Three ways to filter:
| You want | Code |
|---|---|
| Only the first candle where the condition is true | cond.and(cond.shift(1).fillna(0).not()) — or use crossAbove / crossBelow for level crossings |
| No repeat within N candles | cond.and(cond.shift(1).hold(N).fillna(0).not()) |
| How long since it was last true | cond.barsSince() (number of candles; never true → NaN) |
indicator({
  name: "Vào vùng quá bán (lần đầu)",
  pane: "new",
  scale: { range: [0, 100] },
  plot: (d) => {
    const r = ta.rsi(d.close, 14);
    const quaBan = r.lt(30);
    const lanDau = quaBan.and(quaBan.shift(1).fillna(0).not());
    return {
      RSI: line(r, { color: "accent" }),
      "30": hline(30, { color: "up" }),
      "Vào quá bán": shape(lanDau, { at: "bottom", shape: "triangleUp", color: "up" }),
    };
  },
});
x.hold(n) keeps the true state for n more candles after each time it is true; so cond.shift(1).hold(N) is true if cond was true in the previous N + 1 candles — its negation means "don't signal again within that window".
3.6. Defining your own candlestick pattern
The bullish engulfing pattern: the previous candle is down, this candle is up, and this candle's body engulfs the previous candle's body.
indicator({
  name: "Nhấn chìm tăng / giảm",
  pane: "price",
  plot: (d) => {
    const o1 = d.open.shift(1), c1 = d.close.shift(1);
    const tang = c1.lt(o1).and(d.close.gt(d.open)).and(d.close.gte(o1)).and(d.open.lte(c1));
    const giam = c1.gt(o1).and(d.close.lt(d.open)).and(d.close.lte(o1)).and(d.open.gte(c1));
    return {
      "Nhấn chìm tăng": shape(tang, { at: "below", shape: "triangleUp", color: "up" }),
      "Nhấn chìm giảm": shape(giam, { at: "above", shape: "triangleDown", color: "down" }),
    };
  },
});
The library has more than 30 built-in candlestick patterns (hammer, morning star, three white soldiers…): ta.run("candle-patterns", {}) returns bull, bear, neutral — see Template library › Candlestick patterns.
Exercises
- Mark ★ above the candle when the close is the highest in 52 weeks (a new 52-week high on daily candles, i.e. 250 sessions).
- Shade the background light yellow when the 20-period Bollinger Bands are the narrowest in 100 candles.
Solution 1
indicator({
  name: "Đỉnh mới 52 tuần",
  pane: "price",
  plot: (d) => ({
    "Đỉnh mới": shape(d.close.gte(d.close.highest(250)), { at: "above", char: "★", color: "ref" }),
  }),
});
x.highest(n) is the highest value of the latest n candles including this one — so "equal to the highest" means this candle sets a new high.
Solution 2
indicator({
  name: "Bollinger hẹp nhất",
  pane: "price",
  plot: (d) => {
    const w = ta.bb(d.close, 20, 2).width;
    return { "Nén": bgcolor(w.lte(w.lowest(100)), { color: "ref", opacity: 0.12 }) };
  },
});
배울 내용: 조건 작성(보다 크다, 상향 교차, "그리고 / 또는" 결합), 화살표 / 도형 / 문자로 표시, 시간 구간 배경 칠하기, 캔들 색칠, 그리고 신호가 한 번만 나타나도록 거르기.
3.1. 조건은 1 / 0 시계열
모든 비교는 조건 시계열을 만듭니다. 참인 캔들은 1, 거짓인 캔들은 0입니다.
| 조건 | 작성법 |
|---|---|
| 종가가 MA 50 위 | d.close.gt(ta.sma(d.close, 50)) |
| RSI 30 미만 | ta.rsi(d.close, 14).lt(30) |
| RSI가 40–60 안 | ta.rsi(d.close, 14).between(40, 60) |
| EMA 20이 EMA 50을 상향 교차(이전 캔들 ≤, 이번 캔들 >) | ta.ema(d.close, 20).crossAbove(ta.ema(d.close, 50)) |
| 가격이 100을 하향 교차 | d.close.crossBelow(100) |
| 양봉 | d.close.gt(d.open) |
| 거래량이 20 평균의 두 배 | d.volume.gt(ta.sma(d.volume, 20).mul(2)) |
| 두 조건 모두 | a.and(b) |
| 둘 중 하나 | a.or(b) |
| 부정 | a.fillna(0).not() |
3.2. 화살표와 도형
shape(조건, { … })은 조건이 참인 모든 캔들에 표시를 그립니다.
indicator({
  name: "Giá cắt MA 50",
  pane: "price",
  plot: (d) => {
    const ma = ta.sma(d.close, 50);
    return {
      "MA 50": line(ma, { color: "ref" }),
      "Cắt lên": shape(d.close.crossAbove(ma), { at: "below", shape: "arrowUp", color: "up", text: "Mua" }),
      "Cắt xuống": shape(d.close.crossBelow(ma), { at: "above", shape: "arrowDown", color: "down", text: "Bán" }),
    };
  },
});
| 옵션 | 값 |
|---|---|
at | "above" 캔들 위(기본값), "below" 캔들 아래, "value" value 수준에, "top" / "bottom" 패널의 위 / 아래 가장자리 |
shape | "triangleUp", "triangleDown", "arrowUp", "arrowDown", "circle", "square", "diamond", "flag", "label" |
char | 도형 대신 문자 하나, 예: "★", "B" |
text | 표시와 함께 붙는 짧은 글자 |
color / colors | 색 / 색 규칙 |
size | "s", "m", "l" |
value | at: "value"일 때 그릴 수준(숫자 또는 시계열) |
특정 가격 수준에 바로 표시 — 예: 아래꼬리가 긴 캔들의 저점에 점:
indicator({
  name: "Bóng dưới dài",
  pane: "price",
  plot: (d) => {
    const than = d.close.sub(d.open).abs();
    const bongDuoi = d.open.min(d.close).sub(d.low);
    const dai = bongDuoi.gt(than.mul(2)).and(bongDuoi.gt(d.high.sub(d.low).mul(0.5)));
    return {
      "Bóng dưới dài": shape(dai, { at: "value", value: d.low, shape: "circle", color: "up", size: "s" }),
    };
  },
});
a.min(b)는 캔들마다 두 시계열 중 작은 값입니다. 여기서는 캔들 몸통의 아래쪽 경계입니다.
3.3. 배경 칠하기
bgcolor(조건, { color, opacity })는 조건이 참일 때 캔들의 배경 열 전체를 칠합니다. 국면(추세, 과매수 구간…)을 보기에 좋습니다.
indicator({
  name: "Nền theo MA 200",
  pane: "price",
  plot: (d) => {
    const ma = ta.sma(d.close, 200);
    return {
      "MA 200": line(ma, { color: "textMuted", width: 2 }),
      "Trên MA 200": bgcolor(d.close.gt(ma), { color: "up", opacity: 0.06 }),
      "Dưới MA 200": bgcolor(d.close.lt(ma), { color: "down", opacity: 0.06 }),
    };
  },
});
별도 패널 지표에서 bgcolor는 그 패널의 배경을 칠합니다. 가격 패널을 칠하려면 출력 옵션에 pane: "price"를 추가하세요.
3.4. 캔들 색칠
barcolor(조건, { color })는 조건이 참일 때 가격 캔들 자체를 다시 칠합니다.
indicator({
  name: "Nến khối lượng đột biến",
  pane: "price",
  params: { mult: param.num(2, { min: 1.2, max: 10, step: 0.1, label: "Gấp mấy lần TB 20" }) },
  plot: (d, p) => {
    const dotBien = d.volume.gt(ta.sma(d.volume, 20).mul(p.mult));
    return {
      "Đột biến tăng": barcolor(dotBien.and(d.close.gt(d.open)), { color: "ai" }),
      "Đột biến giảm": barcolor(dotBien.and(d.close.lt(d.open)), { color: "ref" }),
    };
  },
});
3.5. 신호는 한 번만
"RSI 30 미만" 같은 조건은 여러 캔들 연속 참이 되어 표시가 빽빽해집니다. 거르는 방법 세 가지:
| 원하는 것 | 작성법 |
|---|---|
| 조건이 참인 첫 캔들만 | cond.and(cond.shift(1).fillna(0).not()) — 수준 돌파라면 crossAbove / crossBelow 사용 |
| N캔들 안에는 다시 알리지 않기 | cond.and(cond.shift(1).hold(N).fillna(0).not()) |
| 가장 최근에 참이었던 때로부터 얼마나 지났는지 | cond.barsSince()(캔들 수; 한 번도 참이 아니면 → NaN) |
indicator({
  name: "Vào vùng quá bán (lần đầu)",
  pane: "new",
  scale: { range: [0, 100] },
  plot: (d) => {
    const r = ta.rsi(d.close, 14);
    const quaBan = r.lt(30);
    const lanDau = quaBan.and(quaBan.shift(1).fillna(0).not());
    return {
      RSI: line(r, { color: "accent" }),
      "30": hline(30, { color: "up" }),
      "Vào quá bán": shape(lanDau, { at: "bottom", shape: "triangleUp", color: "up" }),
    };
  },
});
x.hold(n)은 참이 될 때마다 그 뒤 n캔들 동안 참 상태를 유지합니다. 그래서 cond.shift(1).hold(N)은 cond가 이전 N + 1캔들 안에 참이었으면 참이 되고, 이를 뒤집으면 "그 구간 안에는 다시 알리지 않기"가 됩니다.
3.6. 캔들 패턴 직접 정의하기
상승 장악형 패턴: 이전 캔들은 음봉, 이번 캔들은 양봉이며 이번 캔들의 몸통이 이전 캔들의 몸통을 감쌉니다.
indicator({
  name: "Nhấn chìm tăng / giảm",
  pane: "price",
  plot: (d) => {
    const o1 = d.open.shift(1), c1 = d.close.shift(1);
    const tang = c1.lt(o1).and(d.close.gt(d.open)).and(d.close.gte(o1)).and(d.open.lte(c1));
    const giam = c1.gt(o1).and(d.close.lt(d.open)).and(d.close.lte(o1)).and(d.open.gte(c1));
    return {
      "Nhấn chìm tăng": shape(tang, { at: "below", shape: "triangleUp", color: "up" }),
      "Nhấn chìm giảm": shape(giam, { at: "above", shape: "triangleDown", color: "down" }),
    };
  },
});
라이브러리에는 30개가 넘는 캔들 패턴(망치형, 샛별형, 적삼병…)이 내장되어 있습니다: ta.run("candle-patterns", {})는 bull, bear, neutral을 반환합니다. 예제 라이브러리 › 캔들 패턴을 참고하세요.
연습 문제
- 종가가 52세션 최고일 때(일봉에서 52주 신고가) 캔들 위에 ★를 표시하세요.
- 볼린저 20 밴드가 100캔들 중 가장 좁을 때 연한 노란색 배경을 칠하세요.
풀이 1
indicator({
  name: "Đỉnh mới 52 tuần",
  pane: "price",
  plot: (d) => ({
    "Đỉnh mới": shape(d.close.gte(d.close.highest(250)), { at: "above", char: "★", color: "ref" }),
  }),
});
x.highest(n)은 이번 캔들을 포함한 최근 n캔들의 최댓값입니다. 그래서 "최고값과 같다"는 이번 캔들이 고점을 만들었다는 뜻입니다.
풀이 2
indicator({
  name: "Bollinger hẹp nhất",
  pane: "price",
  plot: (d) => {
    const w = ta.bb(d.close, 20, 2).width;
    return { "Nén": bgcolor(w.lte(w.lowest(100)), { color: "ref", opacity: 0.12 }) };
  },
});
다음: 4강 — 조정 가능한 매개변수
您将学到: 编写条件(大于、上穿、“且 / 或”组合),用箭头 / 图形 / 字符做标记,为时间区段填充背景,为 K 线着色,以及过滤使每个信号只出现一次。
3.1. 条件是一个 1 / 0 序列
每个比较运算都会得到一个条件序列:成立的 K 线上为 1,不成立的 K 线上为 0。
| 条件 | 写法 |
|---|---|
| 收盘价在 MA 50 上方 | d.close.gt(ta.sma(d.close, 50)) |
| RSI 低于 30 | ta.rsi(d.close, 14).lt(30) |
| RSI 位于 40–60 之间 | ta.rsi(d.close, 14).between(40, 60) |
| EMA 20 上穿 EMA 50(上一根 ≤,本根 >) | ta.ema(d.close, 20).crossAbove(ta.ema(d.close, 50)) |
| 价格下穿 100 | d.close.crossBelow(100) |
| 阳线 | d.close.gt(d.open) |
| 成交量是 20 均量的两倍 | d.volume.gt(ta.sma(d.volume, 20).mul(2)) |
| 两个条件同时成立 | a.and(b) |
| 其中之一成立 | a.or(b) |
| 取反 | a.fillna(0).not() |
3.2. 箭头与图形
shape(điều kiện, { … }) 在条件成立的每根 K 线上画一个标记。
indicator({
  name: "Giá cắt MA 50",
  pane: "price",
  plot: (d) => {
    const ma = ta.sma(d.close, 50);
    return {
      "MA 50": line(ma, { color: "ref" }),
      "Cắt lên": shape(d.close.crossAbove(ma), { at: "below", shape: "arrowUp", color: "up", text: "Mua" }),
      "Cắt xuống": shape(d.close.crossBelow(ma), { at: "above", shape: "arrowDown", color: "down", text: "Bán" }),
    };
  },
});
| 选项 | 取值 |
|---|---|
at | "above" K 线上方(默认),"below" K 线下方,"value" 位于 value 水平,"top" / "bottom" 窗格上 / 下边缘 |
shape | "triangleUp", "triangleDown", "arrowUp", "arrowDown", "circle", "square", "diamond", "flag", "label" |
char | 用一个字符代替图形,例如 "★"、"B" |
text | 附在标记旁的短文字 |
color / colors | 颜色 / 颜色规则 |
size | "s", "m", "l" |
value | at: "value" 时的绘制位置(数字或序列) |
把标记直接放在某个价位——例如在下影线很长的 K 线最低点画圆点:
indicator({
  name: "Bóng dưới dài",
  pane: "price",
  plot: (d) => {
    const than = d.close.sub(d.open).abs();
    const bongDuoi = d.open.min(d.close).sub(d.low);
    const dai = bongDuoi.gt(than.mul(2)).and(bongDuoi.gt(d.high.sub(d.low).mul(0.5)));
    return {
      "Bóng dưới dài": shape(dai, { at: "value", value: d.low, shape: "circle", color: "up", size: "s" }),
    };
  },
});
a.min(b) 是两个序列在每根 K 线上的较小值——这里即 K 线实体的下沿。
3.3. 背景着色
bgcolor(điều kiện, { color, opacity }) 在条件成立时为 K 线所在的整列背景着色——适合看清阶段(趋势、超买区…)。
indicator({
  name: "Nền theo MA 200",
  pane: "price",
  plot: (d) => {
    const ma = ta.sma(d.close, 200);
    return {
      "MA 200": line(ma, { color: "textMuted", width: 2 }),
      "Trên MA 200": bgcolor(d.close.gt(ma), { color: "up", opacity: 0.06 }),
      "Dưới MA 200": bgcolor(d.close.lt(ma), { color: "down", opacity: 0.06 }),
    };
  },
});
对于独立窗格指标,bgcolor 给该窗格的背景着色;想给价格窗格着色,请在该输出的选项中加上 pane: "price"。
3.4. K 线着色
barcolor(điều kiện, { color }) 在条件成立时重新为价格 K 线本身着色:
indicator({
  name: "Nến khối lượng đột biến",
  pane: "price",
  params: { mult: param.num(2, { min: 1.2, max: 10, step: 0.1, label: "Gấp mấy lần TB 20" }) },
  plot: (d, p) => {
    const dotBien = d.volume.gt(ta.sma(d.volume, 20).mul(p.mult));
    return {
      "Đột biến tăng": barcolor(dotBien.and(d.close.gt(d.open)), { color: "ai" }),
      "Đột biến giảm": barcolor(dotBien.and(d.close.lt(d.open)), { color: "ref" }),
    };
  },
});
3.5. 每个信号只出现一次
“RSI 低于 30”这类条件会连续多根 K 线成立,因此标记很密集。三种过滤方法:
| 需求 | 写法 |
|---|---|
| 只在条件成立的第一根 K 线 | cond.and(cond.shift(1).fillna(0).not())——如果是越过水平线,也可用 crossAbove / crossBelow |
| N 根 K 线内不重复提示 | cond.and(cond.shift(1).hold(N).fillna(0).not()) |
| 距上次成立已过多久 | cond.barsSince()(K 线数;从未成立 → NaN) |
indicator({
  name: "Vào vùng quá bán (lần đầu)",
  pane: "new",
  scale: { range: [0, 100] },
  plot: (d) => {
    const r = ta.rsi(d.close, 14);
    const quaBan = r.lt(30);
    const lanDau = quaBan.and(quaBan.shift(1).fillna(0).not());
    return {
      RSI: line(r, { color: "accent" }),
      "30": hline(30, { color: "up" }),
      "Vào quá bán": shape(lanDau, { at: "bottom", shape: "triangleUp", color: "up" }),
    };
  },
});
x.hold(n) 在每次成立后再保持成立状态 n 根 K 线;因此如果 cond 在之前 N + 1 根 K 线内成立过,cond.shift(1).hold(N) 即为真——取反就是“在这段时间内不重复提示”。
3.6. 自定义 K 线形态
看涨吞没形态:上一根为阴线,本根为阳线,且本根实体完全包住上一根实体。
indicator({
  name: "Nhấn chìm tăng / giảm",
  pane: "price",
  plot: (d) => {
    const o1 = d.open.shift(1), c1 = d.close.shift(1);
    const tang = c1.lt(o1).and(d.close.gt(d.open)).and(d.close.gte(o1)).and(d.open.lte(c1));
    const giam = c1.gt(o1).and(d.close.lt(d.open)).and(d.close.lte(o1)).and(d.open.gte(c1));
    return {
      "Nhấn chìm tăng": shape(tang, { at: "below", shape: "triangleUp", color: "up" }),
      "Nhấn chìm giảm": shape(giam, { at: "above", shape: "triangleDown", color: "down" }),
    };
  },
});
库中内置 30 多种 K 线形态(锤子线、启明星、红三兵…):ta.run("candle-patterns", {}) 返回 bull、bear、neutral——见模板库 › K 线形态。
练习
- 当收盘价为 52 个交易时段最高时在 K 线上标记 ★(日线上的 52 周新高)。
- 当 Bollinger 20 通道宽度为 100 根 K 线内最窄时,填充淡黄色背景。
答案 1
indicator({
  name: "Đỉnh mới 52 tuần",
  pane: "price",
  plot: (d) => ({
    "Đỉnh mới": shape(d.close.gte(d.close.highest(250)), { at: "above", char: "★", color: "ref" }),
  }),
});
x.highest(n) 是最近 n 根 K 线(包括本根)的最大值——所以“等于最高值”意味着本根 K 线创出新高。
答案 2
indicator({
  name: "Bollinger hẹp nhất",
  pane: "price",
  plot: (d) => {
    const w = ta.bb(d.close, 20, 2).width;
    return { "Nén": bgcolor(w.lte(w.lowest(100)), { color: "ref", opacity: 0.12 }) };
  },
});
下一课: 第 4 课 — 可调参数