Bài 12 — Lọc cả thị trường và Quant AI Studio
- 🇻🇳 Tiếng Việt
- 🇬🇧 English
- 🇰🇷 한국어
- 🇨🇳 中文
Bạn sẽ học: chạy điều kiện của script trên cả một rổ mã để tìm mã vừa có tín hiệu; viết script dùng dữ liệu ngoài giá (khối ngoại, BCTC) cho việc lọc; đưa chiến lược sang Quant AI Studio để kiểm thử trên cả rổ nhiều năm.
12.1. Viết script để lọc
⋯ › Lọc bằng script… chạy script trên từng mã của một rổ rồi giữ các mã thoả một điều kiện. Điều kiện chọn được là:
- mỗi điều kiện trong
alerts(Cảnh báo: …); - mỗi đầu ra
shape,bgcolor,barcolor(Hình: …); - với chiến lược: Tín hiệu mua (▲), Tín hiệu bán (▼), Đang giữ (đã mua, chưa bán).
Các đường (line, area, hist, đường bậc thang) của script thành cột của bảng kết quả (tối đa 4). Vì vậy một script để lọc tốt nên có: điều kiện rõ trong alerts hoặc shape, và vài đường đáng đưa vào cột.
indicator({
  name: "Vượt đỉnh 52 tuần kèm khối lượng",
  pane: "price",
  params: {
    n: param.int(250, { min: 50, max: 500, label: "Số phiên của đỉnh" }),
    vol: param.num(1.5, { min: 1, max: 5, step: 0.1, label: "KL gấp TB 20" }),
  },
  plot: (d, p) => {
    const dinh = d.high.highest(p.n).shift(1);
    const klTB = ta.sma(d.volume, 20);
    return {
      "Đỉnh cũ": line(dinh, { color: "up", dash: "dash", step: true }),
      "KL / TB 20": line(d.volume.div(klTB), { pane: "KL", color: "accent" }),
      "Vượt đỉnh": shape(d.close.gt(dinh).and(d.volume.gt(klTB.mul(p.vol))), { at: "below", shape: "flag", color: "up" }),
    };
  },
  alerts: (d, p) => ({
    "Vượt đỉnh kèm khối lượng": d.close.gt(d.high.highest(p.n).shift(1)).and(d.volume.gt(ta.sma(d.volume, 20).mul(p.vol))),
  }),
});
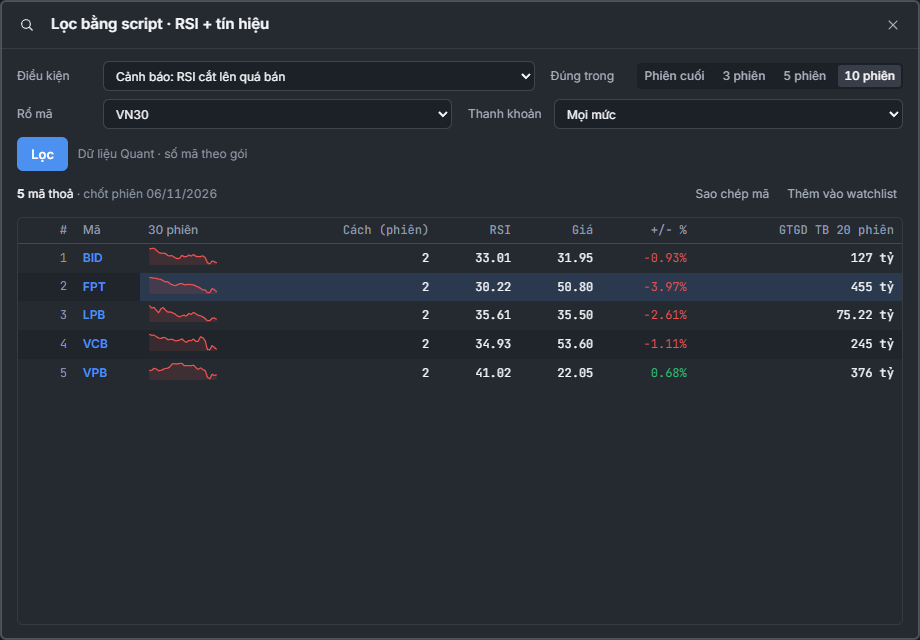
Thêm vào biểu đồ, rồi ⋯ › Lọc bằng script… › Điều kiện = Cảnh báo: Vượt đỉnh kèm khối lượng, Đúng trong = 5 phiên, Rổ mã = Cổ phiếu HOSE, Thanh khoản = ≥ 5 tỷ › Lọc. Kết quả có cột Đỉnh cũ, KL / TB 20 của script cùng giá, % thay đổi, giá trị giao dịch. Chi tiết giao diện: Lọc mã bằng script.
| Rổ | Dữ liệu dùng khi lọc |
|---|---|
| Watchlist, mã tự nhập ≤ 30 mã | Nến ngày như biểu đồ (chỉ giá, khối lượng) |
| Rổ có tên (VN30, HOSE…) hoặc trên 30 mã | Dữ liệu Quant AI Studio: giá, khối lượng và khối ngoại, tự doanh, BCTC, vĩ mô — theo gói (giới hạn) |
Script có onBar chưa lọc được — điều kiện phải viết bằng phép chuỗi.
12.2. Lọc bằng dữ liệu ngoài giá
Khi lọc trên rổ có tên, script đọc được trường dữ liệu của Quant: khối ngoại, tự doanh, định giá, BCTC theo ngày công bố, vĩ mô (Bài 8). Ví dụ: mã được khối ngoại mua ròng 5 phiên liên tiếp trong xu hướng tăng.
// dữ liệu Quant — dùng khi Lọc bằng script trên rổ có tên; trên biểu đồ đường khối ngoại để trống
indicator({
  name: "Khối ngoại mua ròng 5 phiên",
  plot: (d) => {
    const muaRong = d.foreignNet.gt(0);
    const du5 = muaRong.rolling(5).sum().eq(5);
    return {
      "Khối ngoại ròng (tỷ)": hist(d.foreignNet.div(1e9), { up: "up", down: "down" }),
      "Mua ròng 5 phiên": shape(du5.and(d.close.gt(ta.sma(d.close, 50))), { at: "top", shape: "circle", color: "up" }),
    };
  },
  alerts: (d) => ({
    "Khối ngoại mua ròng 5 phiên, giá trên MA 50": d.foreignNet.gt(0).rolling(5).sum().eq(5).and(d.close.gt(ta.sma(d.close, 50))),
  }),
});
d.foreignNet— giá trị mua ròng của khối ngoại (đồng) mỗi phiên.x.rolling(5).sum()— tổng 5 phiên gần nhất; 5 phiên đều mua ròng thì tổng của điều kiện (1 / 0) bằng 5.
Một ví dụ dùng BCTC — mã có ROE (4 quý gần nhất) trên 15 % và lợi nhuận sau thuế 4 quý tăng so với 4 quý liền trước đó:
// dữ liệu Quant — dùng khi Lọc bằng script trên rổ có tên
indicator({
  name: "ROE cao, lợi nhuận tăng",
  plot: (d) => {
    const roe = d.fin("ROE");
    const ln4Quy = d.fin("ProfitAfterTax", { ttm: true });
    const ln4QuyTruoc = d.fin("ProfitAfterTax", { ttm: true, ago: 4 });
    return {
      "ROE (%)": line(roe.mul(100), { color: "accent" }),
      "Đạt": shape(roe.gt(0.15).and(ln4Quy.gt(ln4QuyTruoc)), { at: "top", shape: "circle", color: "up" }),
    };
  },
  alerts: (d) => ({
    "ROE > 15 % và lợi nhuận tăng": d.fin("ROE").gt(0.15).and(d.fin("ProfitAfterTax", { ttm: true }).gt(d.fin("ProfitAfterTax", { ttm: true, ago: 4 }))),
  }),
});
d.fin(chỉTiêu, { ttm, period, ago }) đọc chỉ tiêu BCTC theo ngày công bố (không nhìn trước): ttm: true cộng 4 quý gần nhất (chỉ với chỉ tiêu phát sinh trong quý như doanh thu, lợi nhuận), period: "year" lấy BCTC năm, ago: 4 lấy kỳ cách 4 kỳ. Tỷ lệ như ROE tính dạng số thập phân (0,15 = 15 %). Tên 72 chỉ tiêu và đơn vị: Quant AI Studio › d.fin.
12.3. Mở chiến lược trong Quant AI Studio
⋯ › Mở trong Quant AI Studio đưa script sang Studio: chiến lược thành chiến lược của Studio (chạy trên cả rổ, danh mục nhiều mã, tối ưu, kiểm định độ vững), chỉ báo thành bộ lọc. Bạn chọn rổ khi mở (VN30, VN100, Cổ phiếu HOSE (GTGD ≥ 5 tỷ)…).
Chiến lược có thể khai báo sẵn rổ và cách phân bổ vốn cho Studio — trên biểu đồ các mục này được bỏ qua (biểu đồ luôn chạy trên mã đang xem):
strategy({
  name: "Động lượng có lọc thanh khoản",
  universe: universe("HOSE").liquid(5e9),
  portfolio: { maxPositions: 10, sizing: "equal" },
  params: { n: param.int(60, { min: 20, max: 120, label: "Số phiên đỉnh" }) },
  signals: (d, p) => ({
    entry: d.close.gte(d.close.highest(p.n)).and(d.close.gt(ta.sma(d.close, 200))),
    exit: d.close.lt(ta.sma(d.close, 50)),
    score: d.close.pct(p.n),
  }),
  risk: { stopLoss: 0.1, trailingStop: 0.15 },
});
universe("HOSE").liquid(5e9)— cổ phiếu HOSE có giá trị giao dịch trung bình 20 phiên từ 5 tỷ đồng (xét theo từng thời điểm khi kiểm thử).portfolio.maxPositions: 10— giữ tối đa 10 mã cùng lúc, chia đều vốn.score— khi có nhiều tín hiệu hơn chỗ trống, ưu tiên mã có điểm cao hơn (ở đây: tăng mạnh nhấtnphiên).
Ngược lại, ở Studio, thẻ Lệnh › Hiện trên biểu đồ đánh dấu các lệnh của chiến lược lên biểu đồ FireAnt Chart đang mở.
12.4. Những phép chỉ có ở Studio
Phép so giữa các mã trong cùng một phiên — xếp hạng (rank), chọn top (topN), chuẩn hoá theo rổ (zscore, demean), tổng cả rổ (sumAcross) — chỉ có nghĩa khi có nhiều mã, nên chỉ chạy trong Quant AI Studio. Trên biểu đồ (một mã), script dùng chúng dừng với lỗi:
// ✗ lỗi: universe-only — trên biểu đồ không có rổ để xếp hạng
strategy({
  name: "Top 10 động lượng (chỉ chạy trong Studio)",
  universe: universe("VN100"),
  rank: (d) => d.close.pct(120).rank(),
  select: { top: 10 },
  rebalance: "month",
});
Lỗi hiện là rank() là phép cắt ngang giữa các mã — chỉ dùng được ở dạng rổ (Studio). Chiến lược xoay vòng kiểu này viết và chạy thẳng trong Studio: Quant AI Studio › Chiến lược.
Tổng kết chuỗi bài học
Bạn đã đi từ một đường EMA tới chiến lược có quản lý rủi ro, kiểm thử, tối ưu có kiểm soát và lọc cả thị trường. Từ đây:
- tra cứu mọi hàm ở Tham chiếu và Tra nhanh;
- lấy mẫu có sẵn ở Thư viện mẫu;
- gặp lỗi thì xem Lỗi thường gặp;
- hoặc mô tả ý tưởng bằng lời để Copilot viết giúp.
You will learn: how to run a script's conditions across a whole basket of tickers to find those with a fresh signal; how to write scripts that use non-price data (foreign investors, BCTC) for screening; how to bring a strategy into Quant AI Studio to backtest it on a whole basket over many years.
12.1. Writing a script for screening
⋯ › Lọc bằng script… (Screen with script…) runs the script on each ticker in a basket and keeps the tickers that meet a condition. The conditions you can choose are:
- each condition in
alerts(Cảnh báo: … (Alert: …)); - each
shape,bgcolororbarcoloroutput (Hình: … (Shape: …)); - for strategies: Tín hiệu mua (▲) (Buy signal (▲)), Tín hiệu bán (▼) (Sell signal (▼)), Đang giữ (đã mua, chưa bán) (Holding (bought, not yet sold)).
The script's lines (line, area, hist, step lines) become columns of the results table (up to 4). So a good screening script should have a clear condition in alerts or shape, and a few lines worth showing as columns.
indicator({
  name: "Vượt đỉnh 52 tuần kèm khối lượng",
  pane: "price",
  params: {
    n: param.int(250, { min: 50, max: 500, label: "Số phiên của đỉnh" }),
    vol: param.num(1.5, { min: 1, max: 5, step: 0.1, label: "KL gấp TB 20" }),
  },
  plot: (d, p) => {
    const dinh = d.high.highest(p.n).shift(1);
    const klTB = ta.sma(d.volume, 20);
    return {
      "Đỉnh cũ": line(dinh, { color: "up", dash: "dash", step: true }),
      "KL / TB 20": line(d.volume.div(klTB), { pane: "KL", color: "accent" }),
      "Vượt đỉnh": shape(d.close.gt(dinh).and(d.volume.gt(klTB.mul(p.vol))), { at: "below", shape: "flag", color: "up" }),
    };
  },
  alerts: (d, p) => ({
    "Vượt đỉnh kèm khối lượng": d.close.gt(d.high.highest(p.n).shift(1)).and(d.volume.gt(ta.sma(d.volume, 20).mul(p.vol))),
  }),
});
Add it to the chart, then ⋯ › Lọc bằng script… › Điều kiện (Condition) = Cảnh báo: Vượt đỉnh kèm khối lượng (Alert: Breakout with volume), Đúng trong (True within) = 5 phiên (5 sessions), Rổ mã (Basket) = Cổ phiếu HOSE (HOSE stocks), Thanh khoản (Liquidity) = ≥ 5 tỷ (≥ VND 5 bn) › Lọc (Screen). The results include the script's Đỉnh cũ (Previous high) and KL / TB 20 (Volume / 20-session average) columns along with price, % change and trading value. Interface details: Screening with a script.
| Basket | Data used when screening |
|---|---|
| Watchlist, manually entered tickers ≤ 30 | Daily candles like the chart (price and volume only) |
| Named basket (VN30, HOSE…) or more than 30 tickers | Quant AI Studio data: price, volume and foreign investors, proprietary trading, financial statements, macro — depending on your plan (limits) |
Scripts with onBar cannot be used for screening yet — the condition must be written with series operations.
12.2. Screening with non-price data
When screening a named basket, the script can read Quant data fields: foreign investors, proprietary trading, valuation, financial statements by publication date, macro (Lesson 8). Example: tickers that foreign investors have net bought for 5 consecutive sessions while in an uptrend.
// dữ liệu Quant — dùng khi Lọc bằng script trên rổ có tên; trên biểu đồ đường khối ngoại để trống
indicator({
  name: "Khối ngoại mua ròng 5 phiên",
  plot: (d) => {
    const muaRong = d.foreignNet.gt(0);
    const du5 = muaRong.rolling(5).sum().eq(5);
    return {
      "Khối ngoại ròng (tỷ)": hist(d.foreignNet.div(1e9), { up: "up", down: "down" }),
      "Mua ròng 5 phiên": shape(du5.and(d.close.gt(ta.sma(d.close, 50))), { at: "top", shape: "circle", color: "up" }),
    };
  },
  alerts: (d) => ({
    "Khối ngoại mua ròng 5 phiên, giá trên MA 50": d.foreignNet.gt(0).rolling(5).sum().eq(5).and(d.close.gt(ta.sma(d.close, 50))),
  }),
});
d.foreignNet— foreign investors' net buying value (VND) per session.x.rolling(5).sum()— the sum over the latest 5 sessions; if all 5 sessions were net buying, the sum of the condition (1 / 0) equals 5.
An example using financial statements — tickers with ROE (trailing 4 quarters) above 15% and net profit over the last 4 quarters up versus the 4 quarters before that:
// dữ liệu Quant — dùng khi Lọc bằng script trên rổ có tên
indicator({
  name: "ROE cao, lợi nhuận tăng",
  plot: (d) => {
    const roe = d.fin("ROE");
    const ln4Quy = d.fin("ProfitAfterTax", { ttm: true });
    const ln4QuyTruoc = d.fin("ProfitAfterTax", { ttm: true, ago: 4 });
    return {
      "ROE (%)": line(roe.mul(100), { color: "accent" }),
      "Đạt": shape(roe.gt(0.15).and(ln4Quy.gt(ln4QuyTruoc)), { at: "top", shape: "circle", color: "up" }),
    };
  },
  alerts: (d) => ({
    "ROE > 15 % và lợi nhuận tăng": d.fin("ROE").gt(0.15).and(d.fin("ProfitAfterTax", { ttm: true }).gt(d.fin("ProfitAfterTax", { ttm: true, ago: 4 }))),
  }),
});
d.fin(chỉTiêu, { ttm, period, ago }) reads a financial statement item by publication date (no look-ahead): ttm: true sums the latest 4 quarters (only for items accrued within a quarter, such as revenue and profit), period: "year" uses annual statements, ago: 4 takes the period 4 periods back. Ratios such as ROE are decimals (0.15 = 15%). Names and units of the 72 items: Quant AI Studio › d.fin.
12.3. Opening a strategy in Quant AI Studio
⋯ › Mở trong Quant AI Studio (Open in Quant AI Studio) brings the script into the Studio: a strategy becomes a Studio strategy (runs on a whole basket, multi-ticker portfolio, optimization, robustness validation), an indicator becomes a screener. You choose the basket when opening it (VN30, VN100, Cổ phiếu HOSE (GTGD ≥ 5 tỷ) (HOSE stocks (trading value ≥ VND 5 bn))…).
A strategy can predeclare the basket and capital allocation for the Studio — on the chart these fields are ignored (the chart always runs on the ticker you are viewing):
strategy({
  name: "Động lượng có lọc thanh khoản",
  universe: universe("HOSE").liquid(5e9),
  portfolio: { maxPositions: 10, sizing: "equal" },
  params: { n: param.int(60, { min: 20, max: 120, label: "Số phiên đỉnh" }) },
  signals: (d, p) => ({
    entry: d.close.gte(d.close.highest(p.n)).and(d.close.gt(ta.sma(d.close, 200))),
    exit: d.close.lt(ta.sma(d.close, 50)),
    score: d.close.pct(p.n),
  }),
  risk: { stopLoss: 0.1, trailingStop: 0.15 },
});
universe("HOSE").liquid(5e9)— HOSE stocks with a 20-session average trading value of VND 5 bn or more (evaluated at each point in time during the backtest).portfolio.maxPositions: 10— hold at most 10 tickers at once, splitting capital equally.score— when there are more signals than open slots, tickers with a higher score take priority (here: the strongest gain overnsessions).
Conversely, in the Studio, the Lệnh (Trades) tab › Hiện trên biểu đồ (Show on chart) marks the strategy's trades on the open FireAnt Chart.
12.4. Operations available only in the Studio
Cross-ticker operations within the same session — ranking (rank), picking the top (topN), basket normalization (zscore, demean), basket totals (sumAcross) — only make sense with many tickers, so they only run in Quant AI Studio. On the chart (a single ticker), a script using them stops with an error:
// ✗ lỗi: universe-only — trên biểu đồ không có rổ để xếp hạng
strategy({
  name: "Top 10 động lượng (chỉ chạy trong Studio)",
  universe: universe("VN100"),
  rank: (d) => d.close.pct(120).rank(),
  select: { top: 10 },
  rebalance: "month",
});
The error shown is rank() là phép cắt ngang giữa các mã — chỉ dùng được ở dạng rổ (Studio) (rank() is a cross-sectional operation across tickers — only usable in basket form (Studio)). Rotation strategies like this are written and run directly in the Studio: Quant AI Studio › Strategies.
Series wrap-up
You have gone from a single EMA line to strategies with risk management, backtesting, controlled optimization and whole-market screening. From here:
- look up every function in the Reference and the Cheat sheet;
- grab ready-made examples from the Template library;
- if you hit an error, see Common errors;
- or describe your idea in words and let Copilot write it for you.
배울 내용: 스크립트의 조건을 종목 바스켓 전체에서 실행해 방금 신호가 나온 종목 찾기, 가격 외 데이터(외국인, BCTC)를 쓰는 필터용 스크립트 작성, 전략을 Quant AI Studio로 보내 바스켓 전체에서 여러 해에 걸쳐 테스트하기.
12.1. 필터용 스크립트 작성
⋯ › Lọc bằng script…(스크립트로 필터…)는 바스켓의 각 종목에서 스크립트를 실행한 뒤 조건을 만족하는 종목을 남깁니다. 고를 수 있는 조건은 다음과 같습니다.
alerts의 각 조건(Cảnh báo: …(알림: …));- 각
shape,bgcolor,barcolor출력(Hình: …(도형: …)); - 전략의 경우: Tín hiệu mua (▲)(매수 신호(▲)), Tín hiệu bán (▼)(매도 신호(▼)), Đang giữ (đã mua, chưa bán)(보유 중(매수 후 미매도)).
스크립트의 선(line, area, hist, 계단선)은 결과 표의 열이 됩니다(최대 4개). 그래서 좋은 필터용 스크립트에는 alerts나 shape에 명확한 조건이 있고, 열로 넣을 만한 선이 몇 개 있어야 합니다.
indicator({
  name: "Vượt đỉnh 52 tuần kèm khối lượng",
  pane: "price",
  params: {
    n: param.int(250, { min: 50, max: 500, label: "Số phiên của đỉnh" }),
    vol: param.num(1.5, { min: 1, max: 5, step: 0.1, label: "KL gấp TB 20" }),
  },
  plot: (d, p) => {
    const dinh = d.high.highest(p.n).shift(1);
    const klTB = ta.sma(d.volume, 20);
    return {
      "Đỉnh cũ": line(dinh, { color: "up", dash: "dash", step: true }),
      "KL / TB 20": line(d.volume.div(klTB), { pane: "KL", color: "accent" }),
      "Vượt đỉnh": shape(d.close.gt(dinh).and(d.volume.gt(klTB.mul(p.vol))), { at: "below", shape: "flag", color: "up" }),
    };
  },
  alerts: (d, p) => ({
    "Vượt đỉnh kèm khối lượng": d.close.gt(d.high.highest(p.n).shift(1)).and(d.volume.gt(ta.sma(d.volume, 20).mul(p.vol))),
  }),
});
차트에 추가한 뒤 ⋯ › Lọc bằng script… › Điều kiện(조건) = Cảnh báo: Vượt đỉnh kèm khối lượng(알림: 거래량 동반 고점 돌파), Đúng trong(참인 기간) = 5 phiên(5세션), Rổ mã(종목 바스켓) = Cổ phiếu HOSE(HOSE 주식), Thanh khoản(유동성) = ≥ 5 tỷ(50억 동 이상) › Lọc(필터)를 누릅니다. 결과에는 스크립트의 Đỉnh cũ(이전 고점), KL / TB 20(거래량 / 20일 평균) 열과 함께 가격, 등락률 %, 거래대금이 표시됩니다. 화면 세부 사항: 스크립트로 종목 필터.
| 바스켓 | 필터할 때 쓰는 데이터 |
|---|---|
| 관심종목, 직접 입력한 30종목 이하 | 차트와 같은 일봉(가격, 거래량만) |
| 이름이 있는 바스켓(VN30, HOSE…) 또는 30종목 초과 | Quant AI Studio 데이터: 가격, 거래량 그리고 외국인, 증권사 자기매매, 재무제표, 거시경제 — 플랜에 따라(한도) |
onBar가 있는 스크립트는 아직 필터할 수 없습니다. 조건은 시계열 연산으로 작성해야 합니다.
12.2. 가격 외 데이터로 필터
이름이 있는 바스켓에서 필터할 때 스크립트는 Quant 데이터 필드를 읽을 수 있습니다: 외국인, 증권사 자기매매, 밸류에이션, 공시일 기준 재무제표, 거시경제(8강). 예: 상승 추세에서 외국인이 5세션 연속 순매수한 종목.
// dữ liệu Quant — dùng khi Lọc bằng script trên rổ có tên; trên biểu đồ đường khối ngoại để trống
indicator({
  name: "Khối ngoại mua ròng 5 phiên",
  plot: (d) => {
    const muaRong = d.foreignNet.gt(0);
    const du5 = muaRong.rolling(5).sum().eq(5);
    return {
      "Khối ngoại ròng (tỷ)": hist(d.foreignNet.div(1e9), { up: "up", down: "down" }),
      "Mua ròng 5 phiên": shape(du5.and(d.close.gt(ta.sma(d.close, 50))), { at: "top", shape: "circle", color: "up" }),
    };
  },
  alerts: (d) => ({
    "Khối ngoại mua ròng 5 phiên, giá trên MA 50": d.foreignNet.gt(0).rolling(5).sum().eq(5).and(d.close.gt(ta.sma(d.close, 50))),
  }),
});
d.foreignNet— 세션별 외국인 순매수 금액(동).x.rolling(5).sum()— 최근 5세션의 합계. 5세션 모두 순매수면 조건(1 / 0)의 합이 5가 됩니다.
재무제표를 쓰는 예 — ROE(최근 4분기)가 15 %를 넘고, 4분기 세후 이익이 직전 4분기보다 늘어난 종목:
// dữ liệu Quant — dùng khi Lọc bằng script trên rổ có tên
indicator({
  name: "ROE cao, lợi nhuận tăng",
  plot: (d) => {
    const roe = d.fin("ROE");
    const ln4Quy = d.fin("ProfitAfterTax", { ttm: true });
    const ln4QuyTruoc = d.fin("ProfitAfterTax", { ttm: true, ago: 4 });
    return {
      "ROE (%)": line(roe.mul(100), { color: "accent" }),
      "Đạt": shape(roe.gt(0.15).and(ln4Quy.gt(ln4QuyTruoc)), { at: "top", shape: "circle", color: "up" }),
    };
  },
  alerts: (d) => ({
    "ROE > 15 % và lợi nhuận tăng": d.fin("ROE").gt(0.15).and(d.fin("ProfitAfterTax", { ttm: true }).gt(d.fin("ProfitAfterTax", { ttm: true, ago: 4 }))),
  }),
});
d.fin(chỉTiêu, { ttm, period, ago })는 재무제표 항목을 공시일 기준으로 읽습니다(미래 참조 없음). ttm: true는 최근 4분기를 합산하고(매출, 이익처럼 분기 중에 발생하는 항목만), period: "year"는 연간 재무제표를, ago: 4는 4기 전을 가져옵니다. ROE 같은 비율은 소수로 계산됩니다(0.15 = 15 %). 72개 항목의 이름과 단위: Quant AI Studio › d.fin.
12.3. Quant AI Studio에서 전략 열기
⋯ › Mở trong Quant AI Studio(Quant AI Studio에서 열기)는 스크립트를 Studio로 보냅니다. 전략은 Studio의 전략(바스켓 전체 실행, 다종목 포트폴리오, 최적화, 견고성 검증)이 되고, 지표는 필터가 됩니다. 열 때 바스켓을 고릅니다(VN30, VN100, Cổ phiếu HOSE (GTGD ≥ 5 tỷ)(HOSE 주식(거래대금 50억 동 이상))…).
전략은 Studio용 바스켓과 자본 배분 방식을 미리 선언할 수 있습니다. 차트에서는 이 항목들이 무시됩니다(차트는 항상 보고 있는 종목에서 실행).
strategy({
  name: "Động lượng có lọc thanh khoản",
  universe: universe("HOSE").liquid(5e9),
  portfolio: { maxPositions: 10, sizing: "equal" },
  params: { n: param.int(60, { min: 20, max: 120, label: "Số phiên đỉnh" }) },
  signals: (d, p) => ({
    entry: d.close.gte(d.close.highest(p.n)).and(d.close.gt(ta.sma(d.close, 200))),
    exit: d.close.lt(ta.sma(d.close, 50)),
    score: d.close.pct(p.n),
  }),
  risk: { stopLoss: 0.1, trailingStop: 0.15 },
});
universe("HOSE").liquid(5e9)— 20세션 평균 거래대금이 50억 동 이상인 HOSE 주식(테스트 시 시점별로 판단).portfolio.maxPositions: 10— 동시에 최대 10종목 보유, 자본 균등 분배.score— 빈자리보다 신호가 많으면 점수가 높은 종목을 우선(여기서는n세션 동안 가장 많이 오른 종목).
반대로 Studio에서는 Lệnh(주문) 탭 › Hiện trên biểu đồ(차트에 표시)가 전략의 주문을 열려 있는 FireAnt Chart 차트에 표시합니다.
12.4. Studio에만 있는 연산
같은 세션 안에서 종목 간 비교 연산 — 순위(rank), 상위 선택(topN), 바스켓 기준 표준화(zscore, demean), 바스켓 전체 합(sumAcross) — 은 여러 종목이 있을 때만 의미가 있으므로 Quant AI Studio에서만 실행됩니다. 차트(한 종목)에서는 이를 쓰는 스크립트가 오류로 멈춥니다.
// ✗ lỗi: universe-only — trên biểu đồ không có rổ để xếp hạng
strategy({
  name: "Top 10 động lượng (chỉ chạy trong Studio)",
  universe: universe("VN100"),
  rank: (d) => d.close.pct(120).rank(),
  select: { top: 10 },
  rebalance: "month",
});
표시되는 오류는 rank() là phép cắt ngang giữa các mã — chỉ dùng được ở dạng rổ (Studio)(rank()는 종목 간 횡단 연산 — 바스켓 형태(Studio)에서만 사용 가능)입니다. 이런 순환 전략은 Studio에서 바로 작성하고 실행하세요: Quant AI Studio › 전략.
강의 시리즈 정리
EMA 선 하나에서 시작해 위험 관리, 테스트, 통제된 최적화, 시장 전체 필터를 갖춘 전략까지 왔습니다. 이제부터는:
- 모든 함수는 레퍼런스와 빠른 참조에서 찾아보세요.
- 바로 쓸 수 있는 예제는 예제 라이브러리에서 가져오세요.
- 오류가 나면 자주 발생하는 오류를 보세요.
- 또는 아이디어를 말로 설명해 Copilot이 대신 작성하게 하세요.
您将学到: 在整个代码篮子上运行脚本条件,找出刚出现信号的代码;编写使用价格之外数据(外资、BCTC)的筛选脚本;把策略带到 Quant AI Studio,在整个篮子上进行多年测试。
12.1. 编写用于筛选的脚本
⋯ › Lọc bằng script…(用脚本筛选…)在篮子中的每个代码上运行脚本,然后保留满足某个条件的代码。可选的条件有:
alerts中的每个条件(Cảnh báo: …,即提醒:…);- 每个
shape、bgcolor、barcolor输出(Hình: …,即图形:…); - 对于策略:Tín hiệu mua (▲)(买入信号)、Tín hiệu bán (▼)(卖出信号)、Đang giữ (đã mua, chưa bán)(持有中,已买入未卖出)。
脚本的线条(line、area、hist、阶梯线)会成为结果表的列(最多 4 列)。因此,好的筛选脚本应当具备:在 alerts 或 shape 中有清晰的条件,以及几条值得放进列中的线。
indicator({
  name: "Vượt đỉnh 52 tuần kèm khối lượng",
  pane: "price",
  params: {
    n: param.int(250, { min: 50, max: 500, label: "Số phiên của đỉnh" }),
    vol: param.num(1.5, { min: 1, max: 5, step: 0.1, label: "KL gấp TB 20" }),
  },
  plot: (d, p) => {
    const dinh = d.high.highest(p.n).shift(1);
    const klTB = ta.sma(d.volume, 20);
    return {
      "Đỉnh cũ": line(dinh, { color: "up", dash: "dash", step: true }),
      "KL / TB 20": line(d.volume.div(klTB), { pane: "KL", color: "accent" }),
      "Vượt đỉnh": shape(d.close.gt(dinh).and(d.volume.gt(klTB.mul(p.vol))), { at: "below", shape: "flag", color: "up" }),
    };
  },
  alerts: (d, p) => ({
    "Vượt đỉnh kèm khối lượng": d.close.gt(d.high.highest(p.n).shift(1)).and(d.volume.gt(ta.sma(d.volume, 20).mul(p.vol))),
  }),
});
添加到图表后,⋯ › Lọc bằng script… › Điều kiện(条件)= Cảnh báo: Vượt đỉnh kèm khối lượng(提醒:放量突破高点),Đúng trong(成立于)= 5 phiên(5 个交易时段),Rổ mã(代码篮子)= Cổ phiếu HOSE(HOSE 股票),Thanh khoản(流动性)= ≥ 5 tỷ(≥ 50 亿越南盾)› Lọc(筛选)。结果中包含脚本的 Đỉnh cũ(前高)、KL / TB 20(成交量 / 20 均量)列,以及价格、涨跌幅、成交额。界面详情:用脚本筛选代码。
| 篮子 | 筛选时使用的数据 |
|---|---|
| 自选股、自行输入 ≤ 30 个代码 | 与图表相同的日 K 线(仅价格、成交量) |
| 有名称的篮子(VN30、HOSE…)或超过 30 个代码 | Quant AI Studio 的数据:价格、成交量以及外资、自营交易、财务报表、宏观——视套餐而定(限制) |
带 onBar 的脚本暂时不能用于筛选——条件必须用序列运算编写。
12.2. 用价格之外的数据筛选
在有名称的篮子上筛选时,脚本可以读取 Quant 的数据字段:外资、自营交易、估值、按公布日期的财务报表、宏观(第 8 课)。示例:处于上升趋势且外资连续 5 个交易时段净买入的代码。
// dữ liệu Quant — dùng khi Lọc bằng script trên rổ có tên; trên biểu đồ đường khối ngoại để trống
indicator({
  name: "Khối ngoại mua ròng 5 phiên",
  plot: (d) => {
    const muaRong = d.foreignNet.gt(0);
    const du5 = muaRong.rolling(5).sum().eq(5);
    return {
      "Khối ngoại ròng (tỷ)": hist(d.foreignNet.div(1e9), { up: "up", down: "down" }),
      "Mua ròng 5 phiên": shape(du5.and(d.close.gt(ta.sma(d.close, 50))), { at: "top", shape: "circle", color: "up" }),
    };
  },
  alerts: (d) => ({
    "Khối ngoại mua ròng 5 phiên, giá trên MA 50": d.foreignNet.gt(0).rolling(5).sum().eq(5).and(d.close.gt(ta.sma(d.close, 50))),
  }),
});
d.foreignNet——每个交易时段外资的净买入额(越南盾)。x.rolling(5).sum()——最近 5 个交易时段之和;5 个交易时段都是净买入时,条件(1 / 0)之和等于 5。
一个使用财务报表的示例——ROE(最近 4 个季度)高于 15%,且最近 4 个季度税后利润高于再之前 4 个季度的代码:
// dữ liệu Quant — dùng khi Lọc bằng script trên rổ có tên
indicator({
  name: "ROE cao, lợi nhuận tăng",
  plot: (d) => {
    const roe = d.fin("ROE");
    const ln4Quy = d.fin("ProfitAfterTax", { ttm: true });
    const ln4QuyTruoc = d.fin("ProfitAfterTax", { ttm: true, ago: 4 });
    return {
      "ROE (%)": line(roe.mul(100), { color: "accent" }),
      "Đạt": shape(roe.gt(0.15).and(ln4Quy.gt(ln4QuyTruoc)), { at: "top", shape: "circle", color: "up" }),
    };
  },
  alerts: (d) => ({
    "ROE > 15 % và lợi nhuận tăng": d.fin("ROE").gt(0.15).and(d.fin("ProfitAfterTax", { ttm: true }).gt(d.fin("ProfitAfterTax", { ttm: true, ago: 4 }))),
  }),
});
d.fin(chỉTiêu, { ttm, period, ago }) 按公布日期读取财务报表指标(不偷看未来):ttm: true 累加最近 4 个季度(仅适用于季度内发生的指标,如营收、利润),period: "year" 取年度财务报表,ago: 4 取往前第 4 期。ROE 等比率以小数表示(0.15 = 15%)。72 个指标的名称和单位:Quant AI Studio › d.fin。
12.3. 在 Quant AI Studio 中打开策略
⋯ › Mở trong Quant AI Studio(在 Quant AI Studio 中打开)把脚本带到 Studio:策略成为 Studio 的策略(在整个篮子上运行、多代码投资组合、优化、稳健性检验),指标成为选股器。打开时您选择篮子(VN30、VN100、Cổ phiếu HOSE (GTGD ≥ 5 tỷ)(HOSE 股票,成交额 ≥ 50 亿越南盾)…)。
策略可以为 Studio 预先声明篮子和资金分配方式——在图表上这些项会被忽略(图表始终在当前查看的代码上运行):
strategy({
  name: "Động lượng có lọc thanh khoản",
  universe: universe("HOSE").liquid(5e9),
  portfolio: { maxPositions: 10, sizing: "equal" },
  params: { n: param.int(60, { min: 20, max: 120, label: "Số phiên đỉnh" }) },
  signals: (d, p) => ({
    entry: d.close.gte(d.close.highest(p.n)).and(d.close.gt(ta.sma(d.close, 200))),
    exit: d.close.lt(ta.sma(d.close, 50)),
    score: d.close.pct(p.n),
  }),
  risk: { stopLoss: 0.1, trailingStop: 0.15 },
});
universe("HOSE").liquid(5e9)——20 个交易时段平均成交额达 50 亿越南盾及以上的 HOSE 股票(测试时按每个时间点判断)。portfolio.maxPositions: 10——同时最多持有 10 个代码,资金平均分配。score——当信号多于空余仓位时,优先选择得分更高的代码(此处:n个交易时段内涨幅最大)。
反过来,在 Studio 中,Lệnh(委托)标签页 › Hiện trên biểu đồ(在图表上显示)会把策略的委托标记到当前打开的 FireAnt Chart 图表上。
12.4. 仅 Studio 支持的运算
同一交易时段内跨代码比较的运算——排名(rank)、选前 N(topN)、按篮子标准化(zscore、demean)、全篮子求和(sumAcross)——只有在有多个代码时才有意义,因此只在 Quant AI Studio 中运行。在图表上(单个代码),使用它们的脚本会报错停止:
// ✗ lỗi: universe-only — trên biểu đồ không có rổ để xếp hạng
strategy({
  name: "Top 10 động lượng (chỉ chạy trong Studio)",
  universe: universe("VN100"),
  rank: (d) => d.close.pct(120).rank(),
  select: { top: 10 },
  rebalance: "month",
});
显示的错误为 rank() là phép cắt ngang giữa các mã — chỉ dùng được ở dạng rổ (Studio)(rank() 是跨代码的横截面运算——只能在篮子形式(Studio)中使用)。这类轮动策略请直接在 Studio 中编写和运行:Quant AI Studio › 策略。
系列课程总结
您已经从一条 EMA 线一路学到带风险管理的策略、测试、有控制的优化以及全市场筛选。接下来:
- 在参考和速查中查阅所有函数;
- 在模板库中获取现成模板;
- 遇到错误时查看常见错误;
- 或用文字描述想法,让 Copilot 帮您编写。